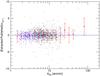
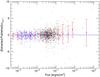
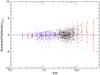
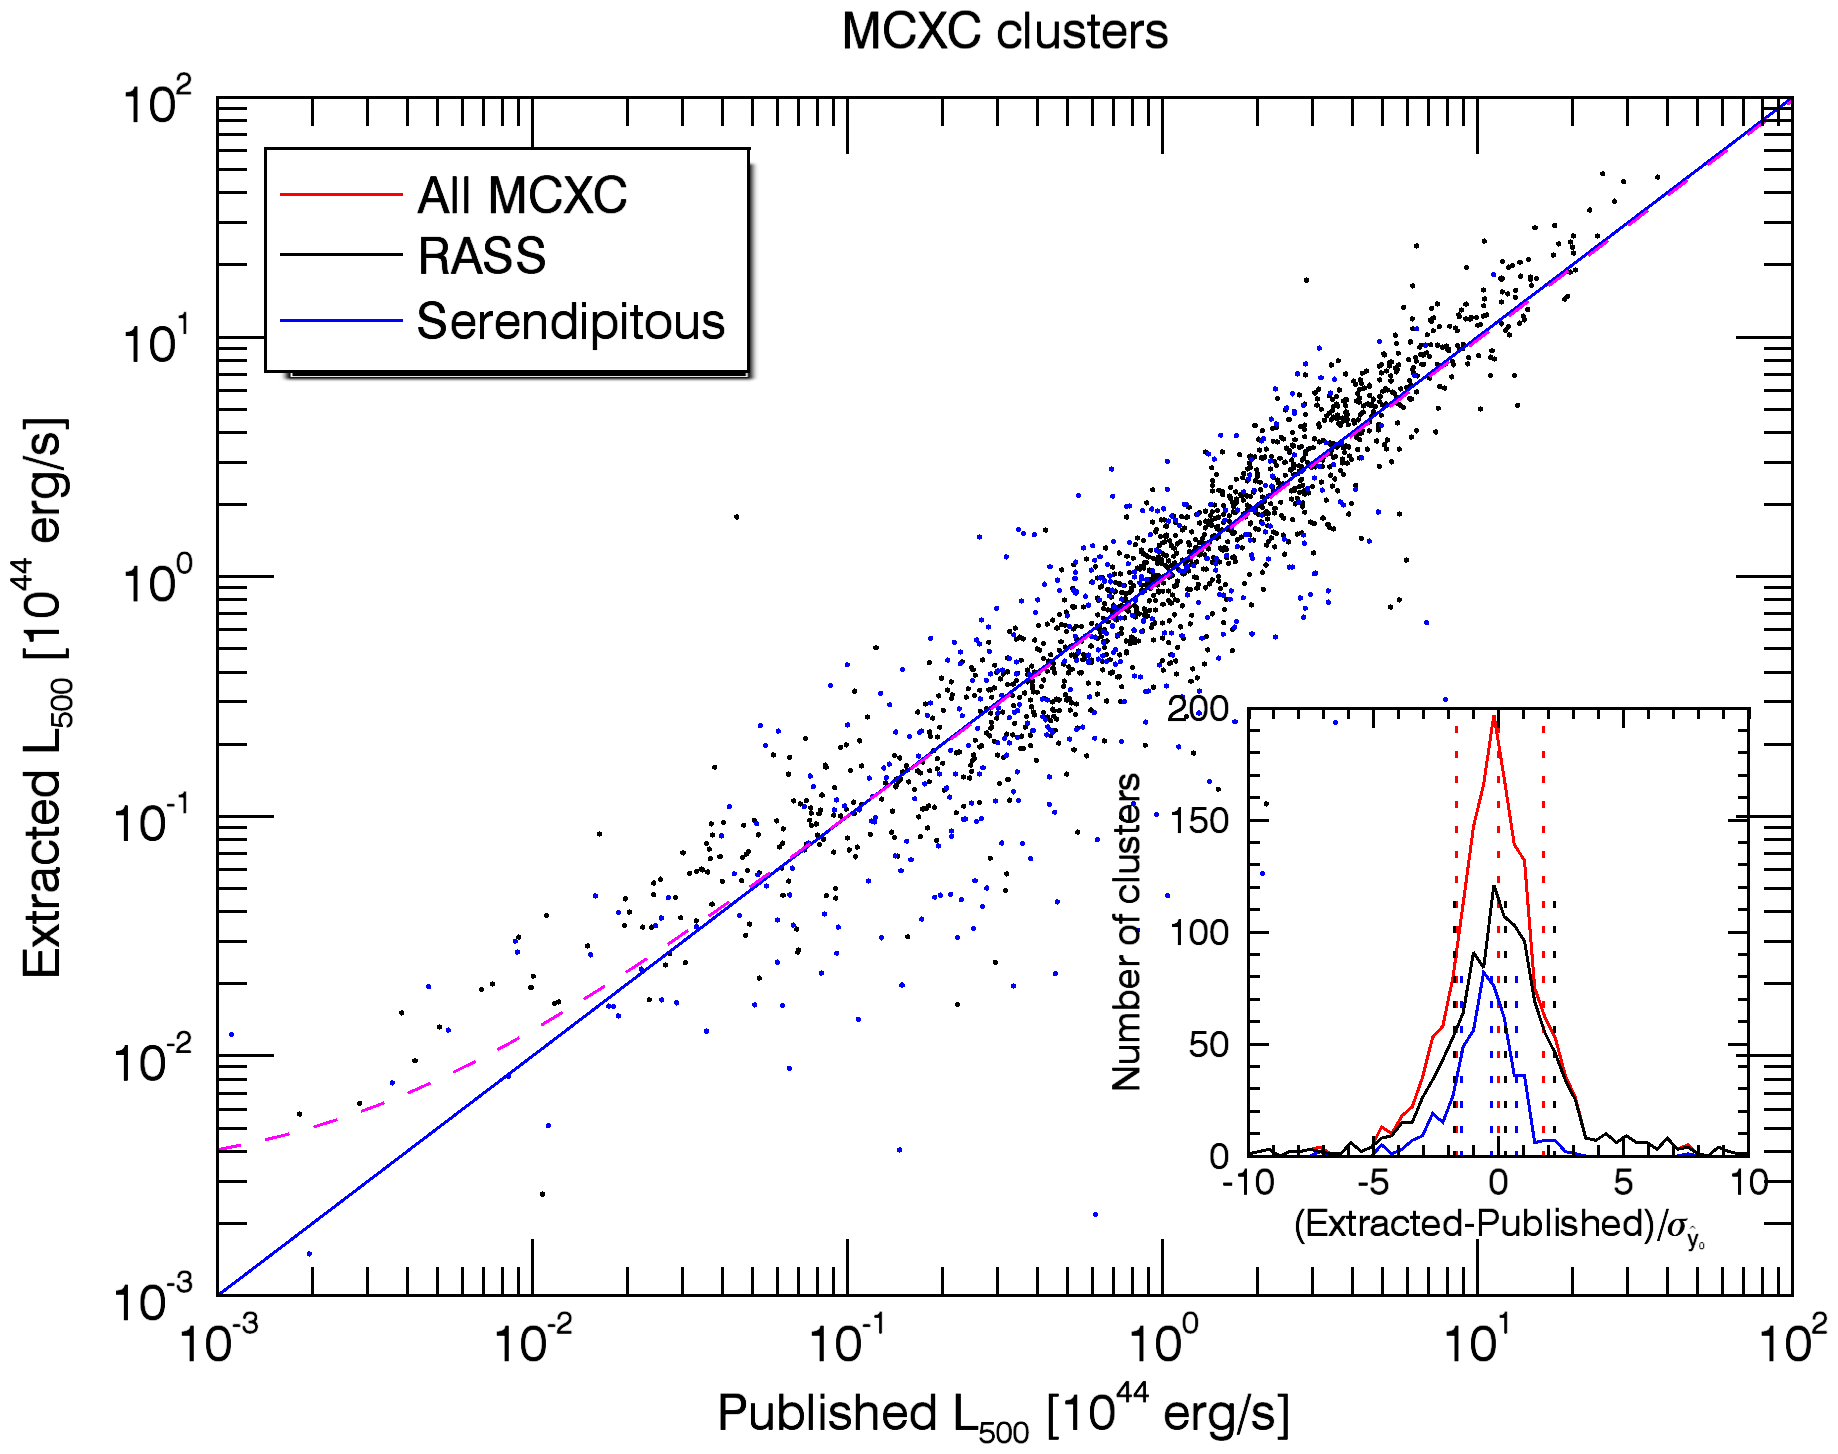
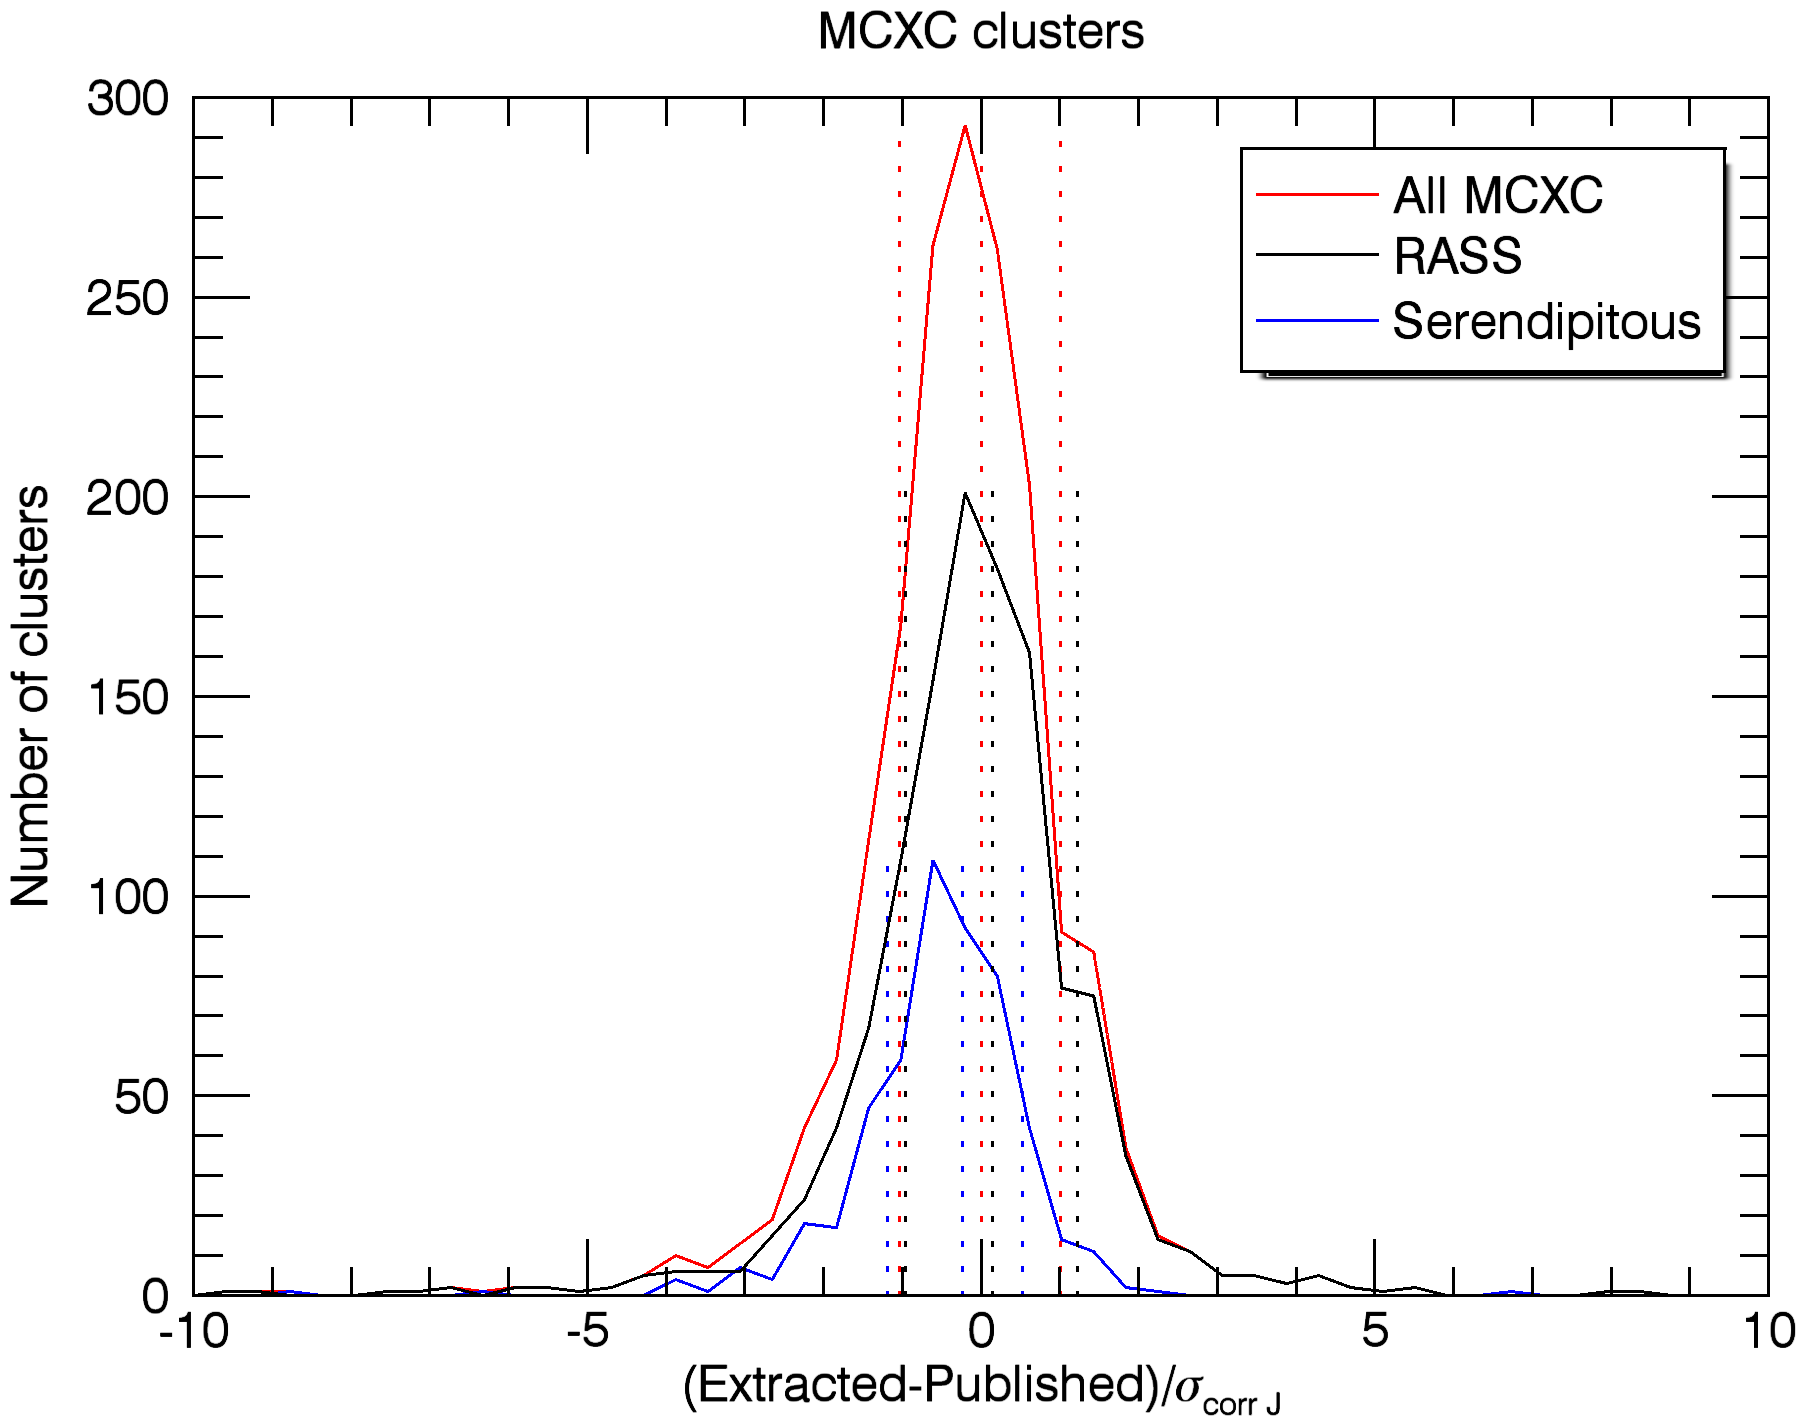
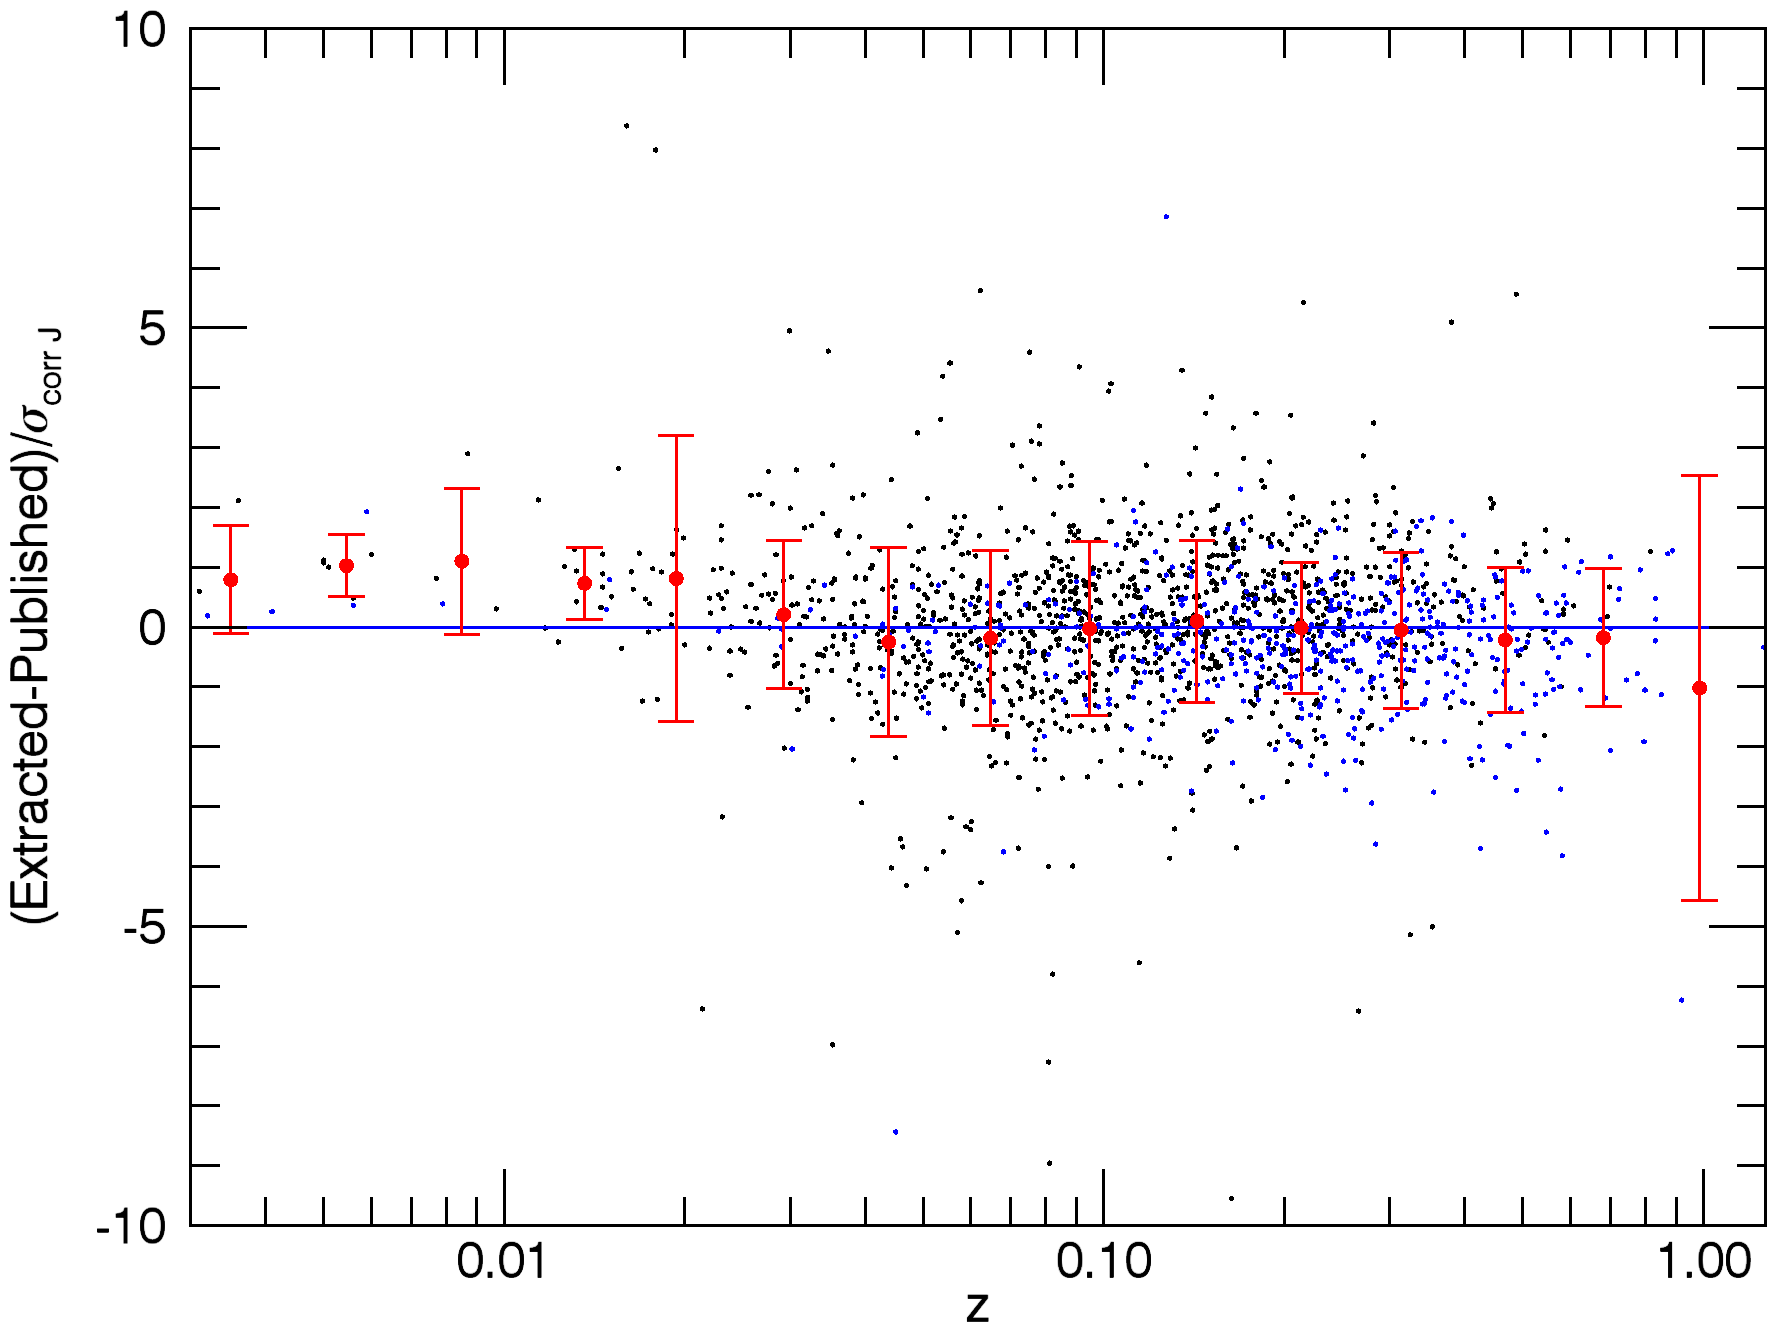
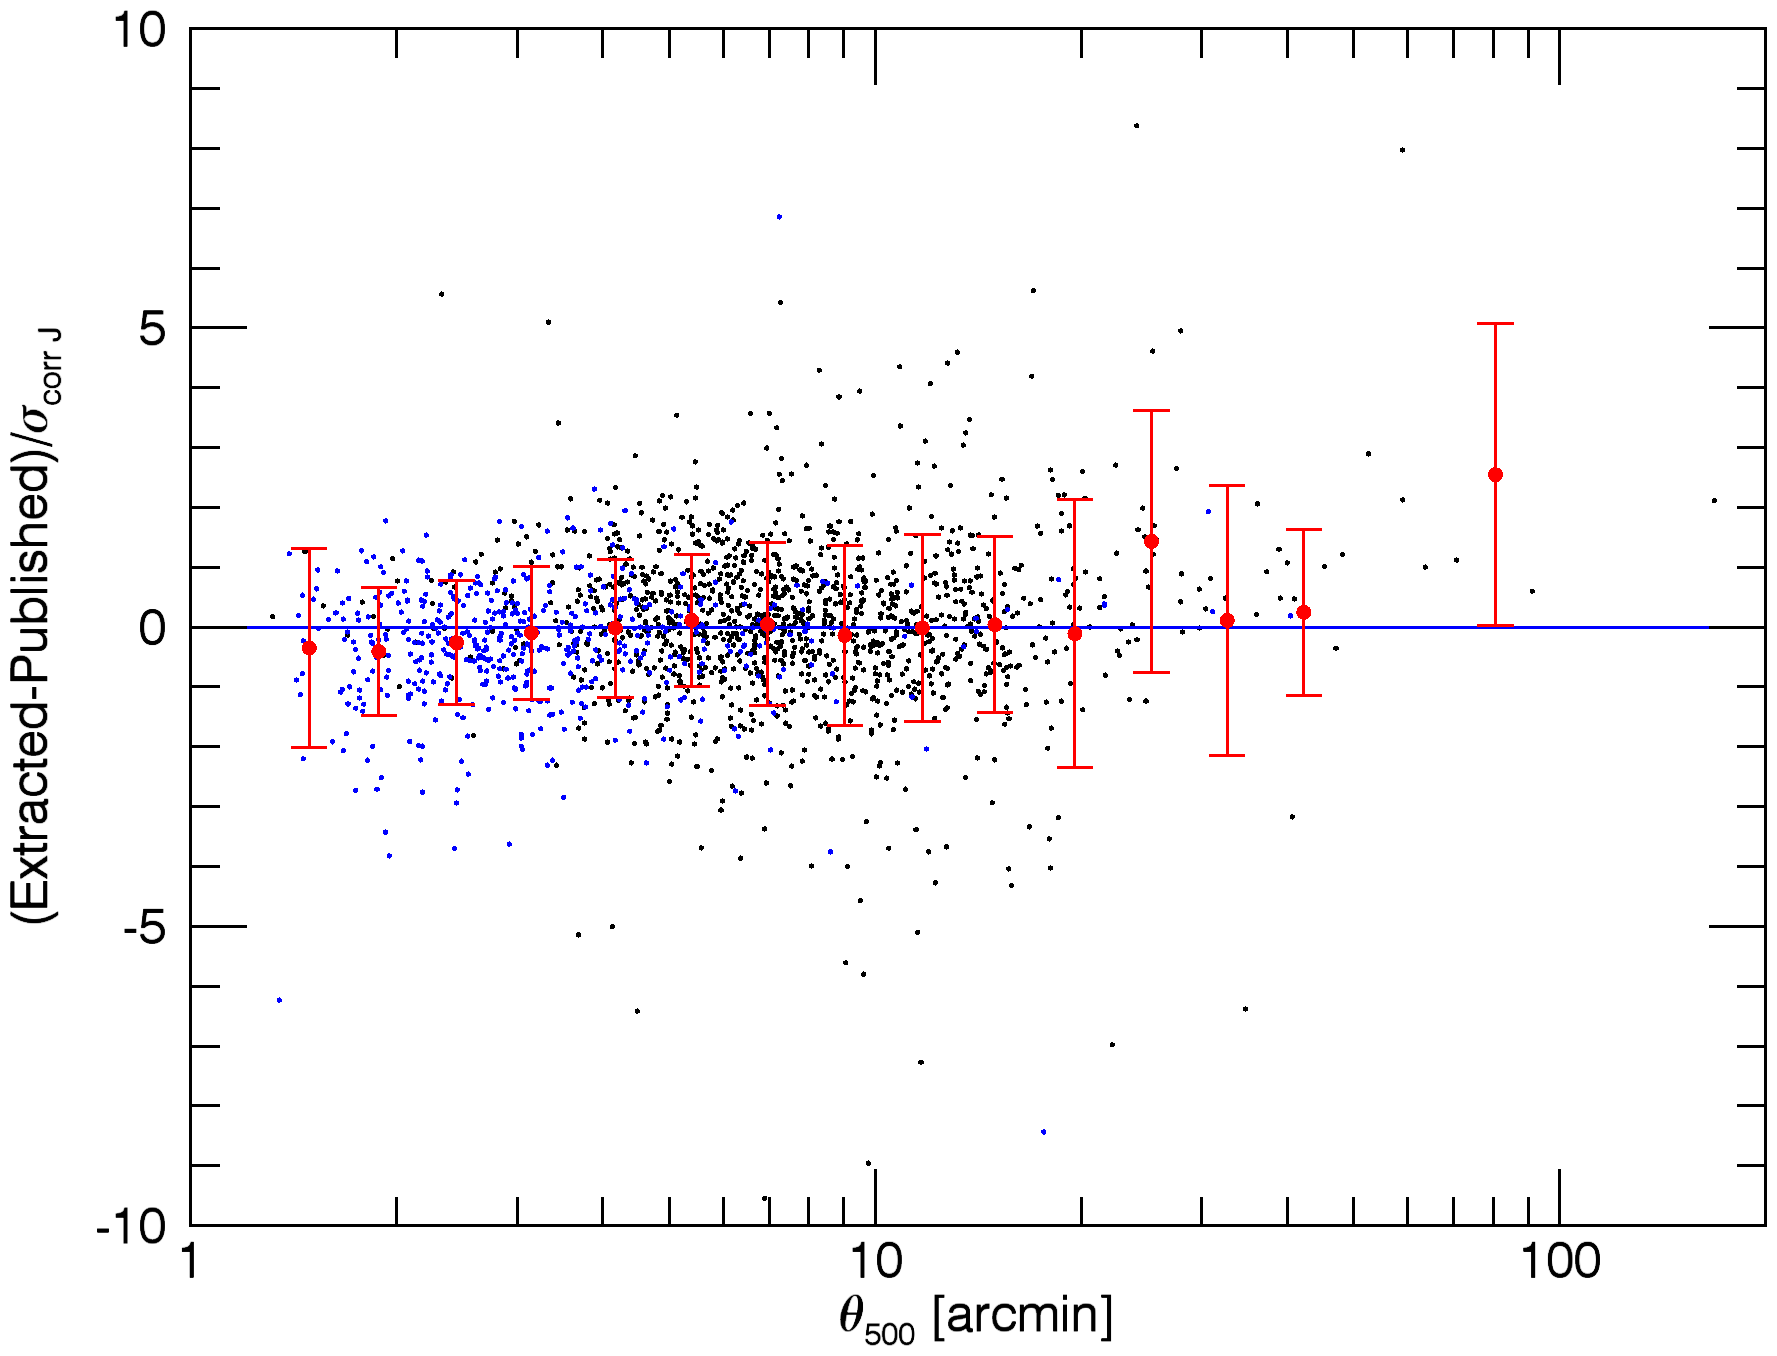
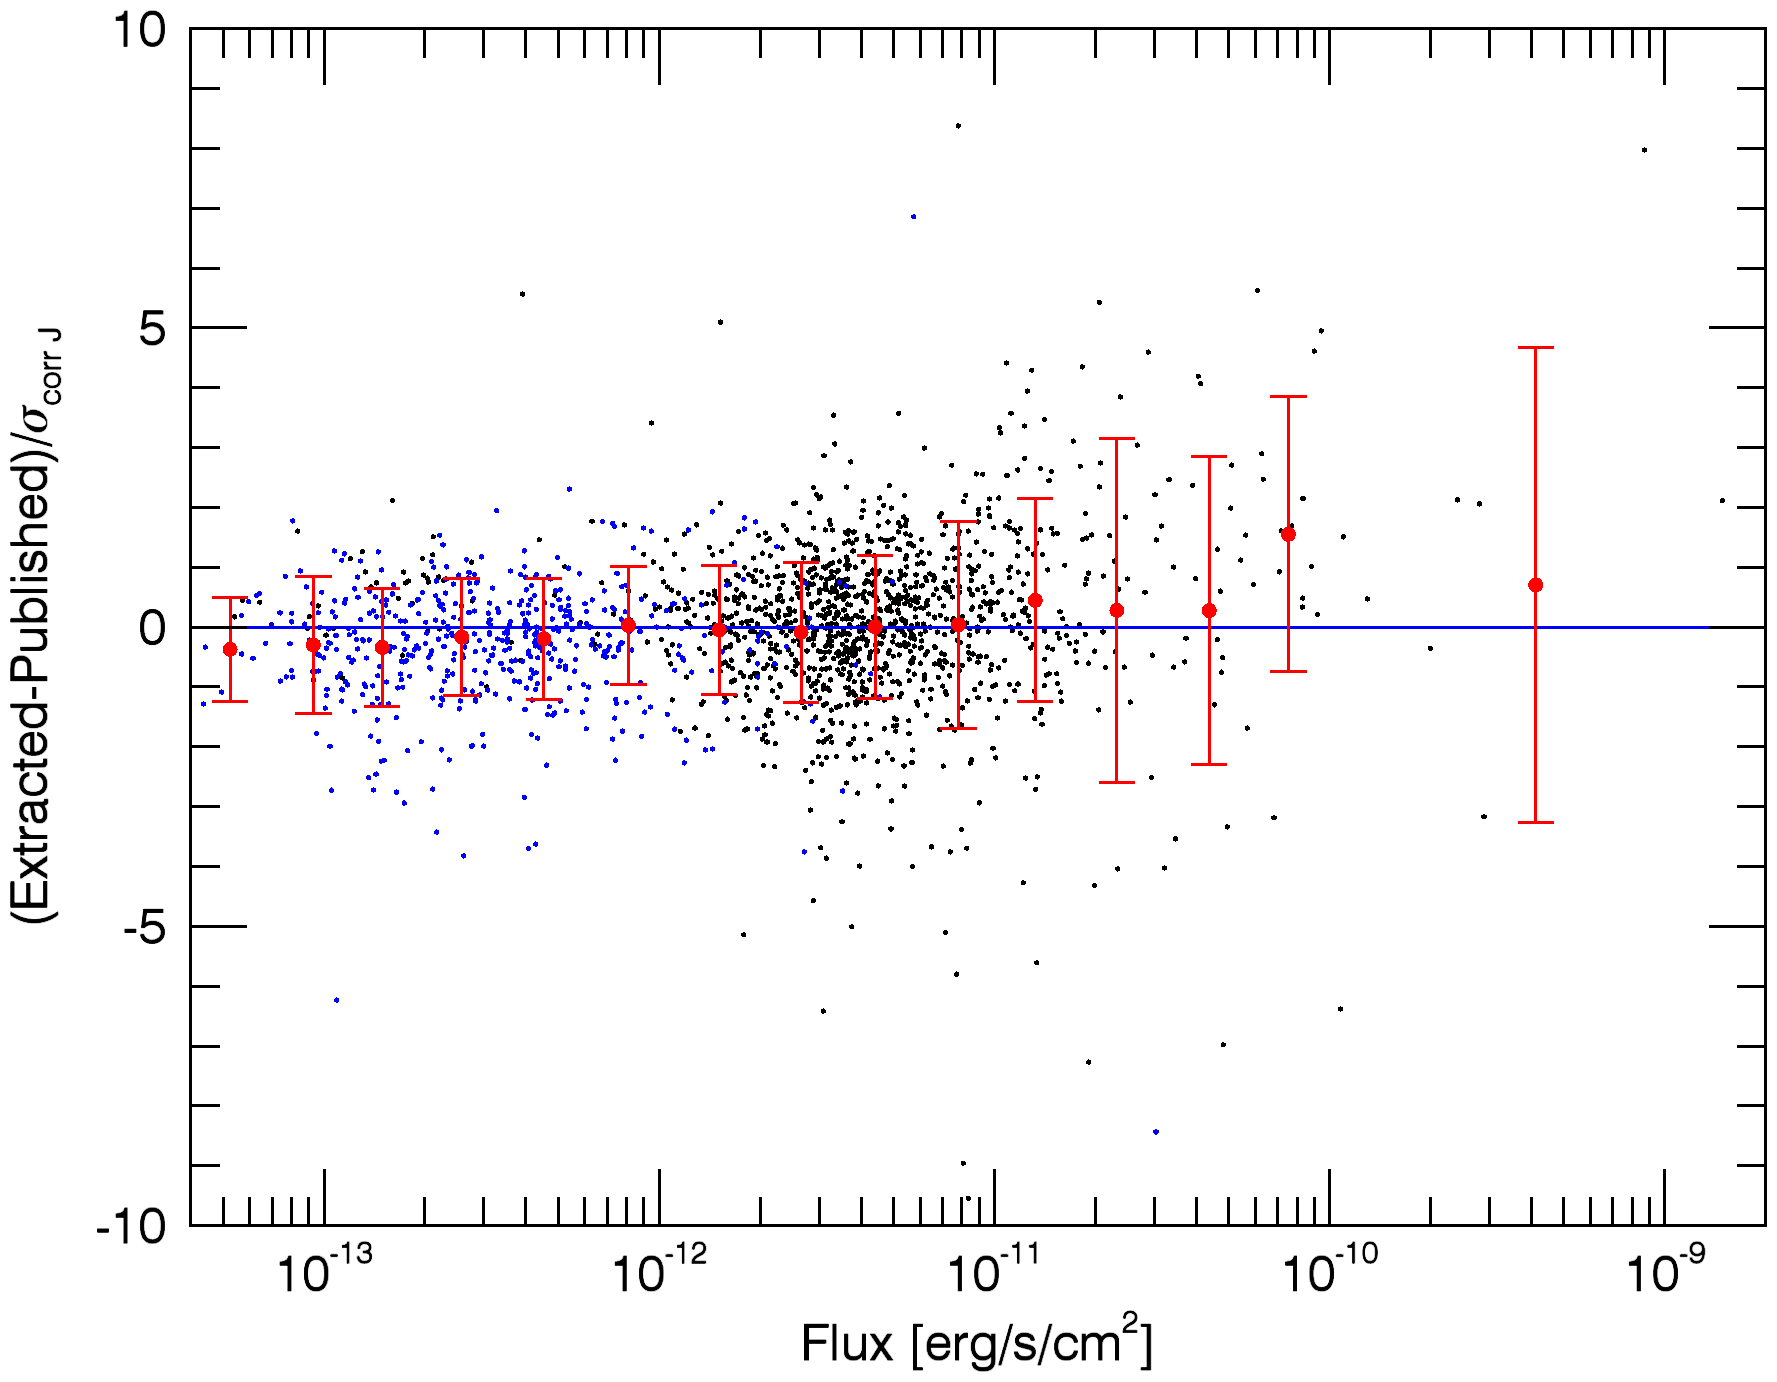
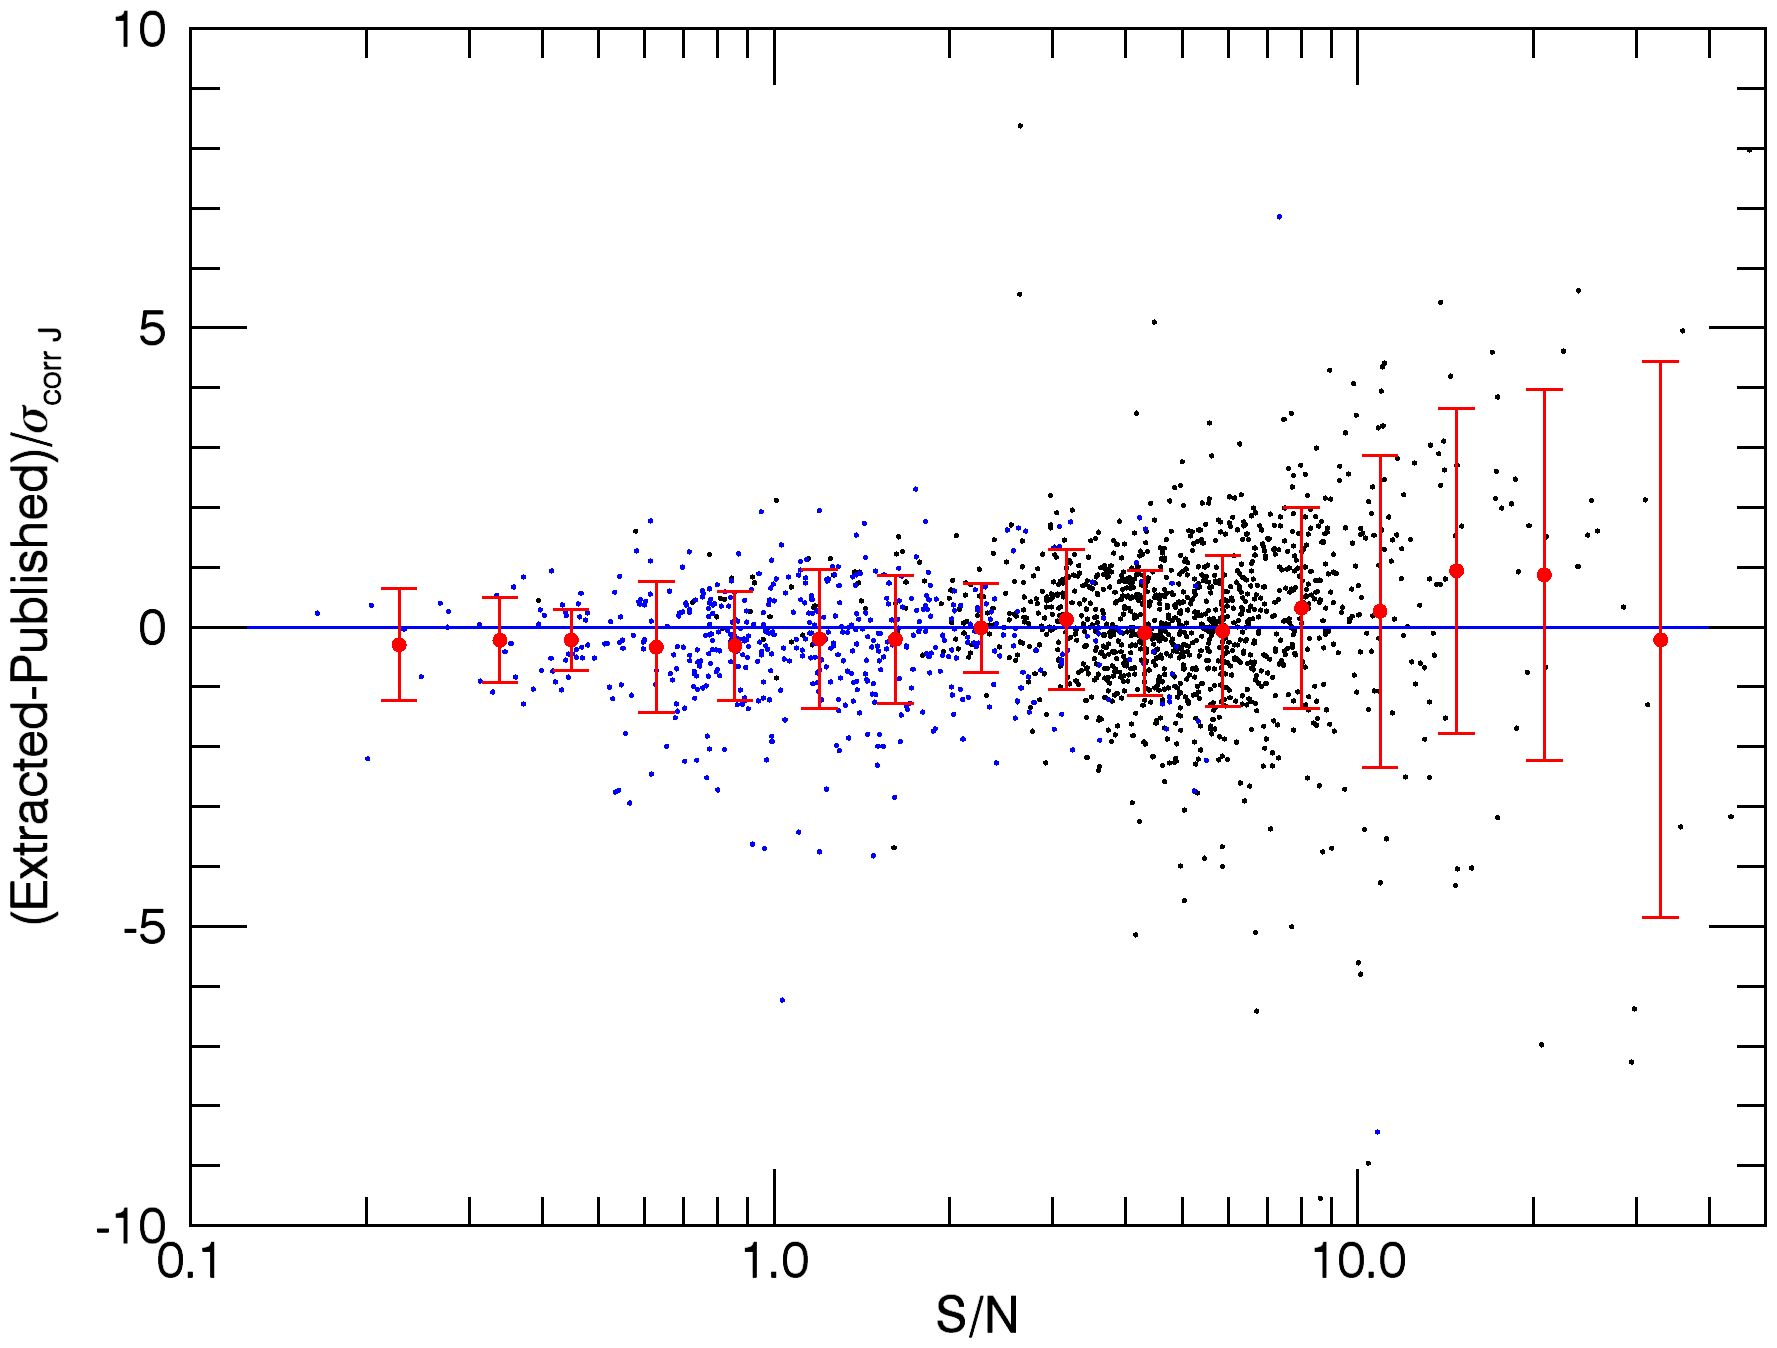
Fig. 14
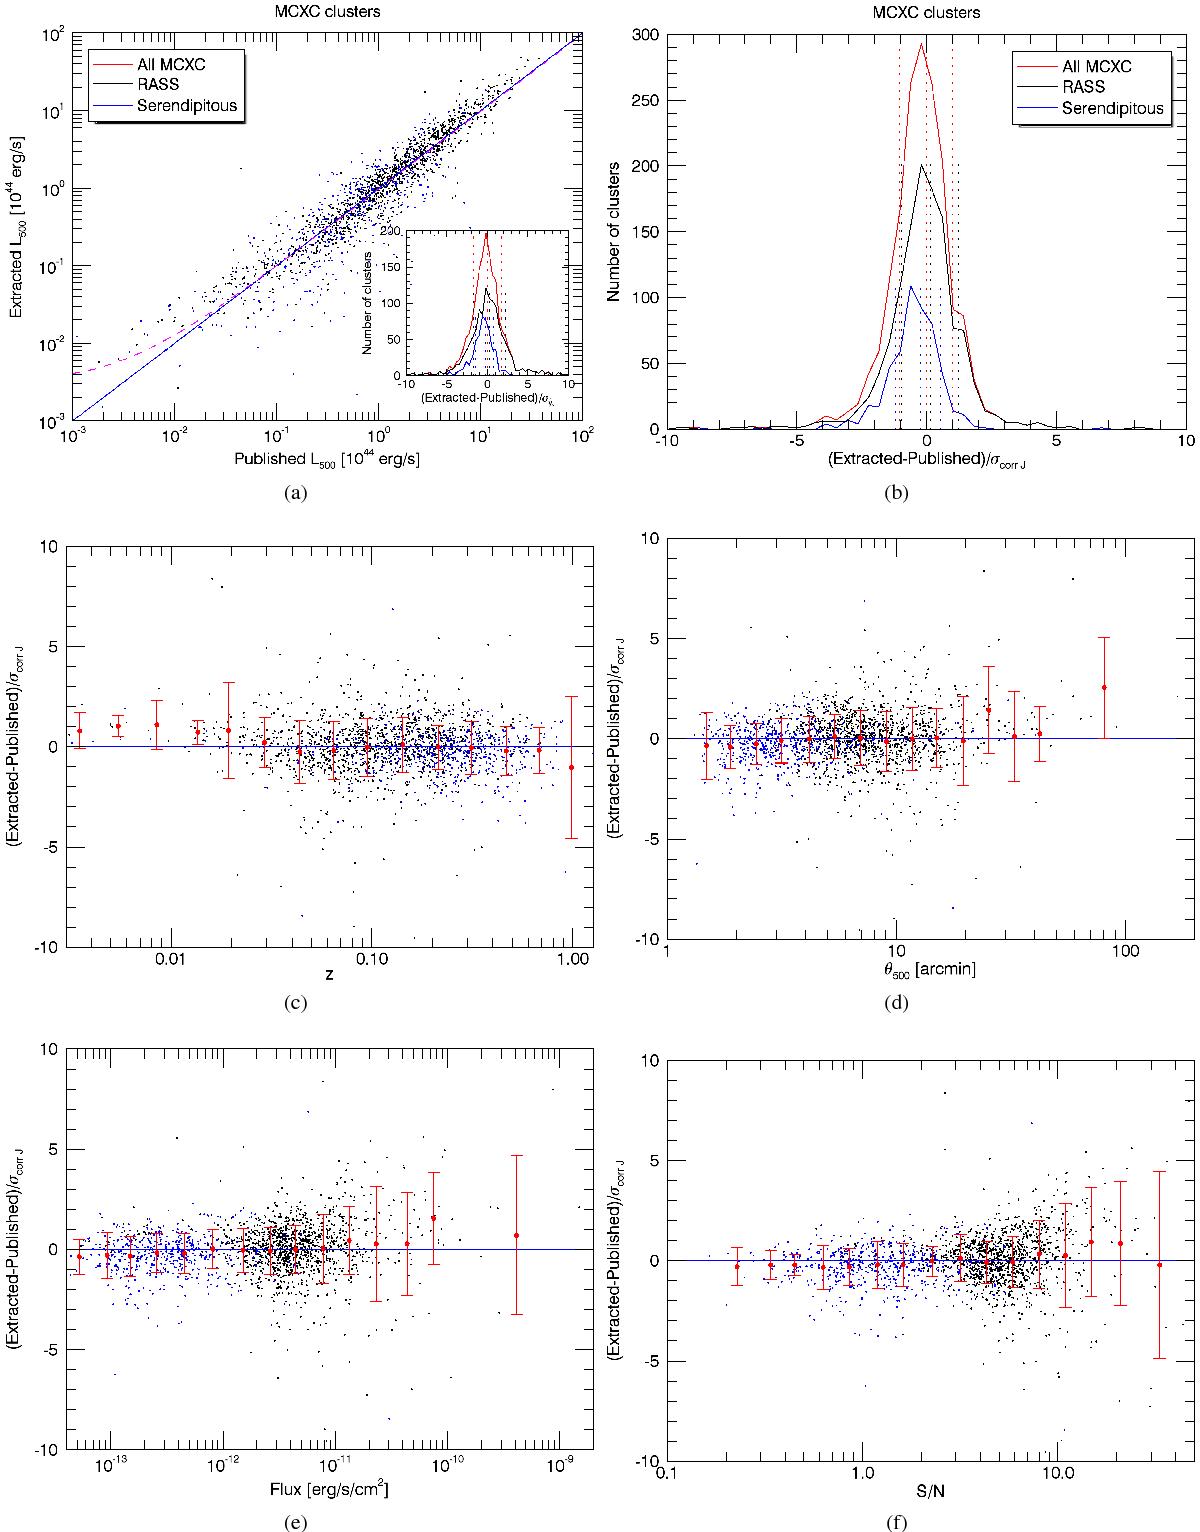
Photometry results of the extraction of the MCXC clusters using the proposed X-ray-SZ filter with the average cluster profile and assuming the position, size, and redshift of the clusters are known. The top left panel is analogous to the top left panel of Fig. 2, and its subpanel shows the histogram of the difference between the extracted and the published L500, divided by the estimated ![]() (analogously to Fig. 2b). The five other panels are analogous to those in Fig. 2, but in this case, the standard deviation used to normalize the difference between the extracted and the published L500 is already corrected for the effect of the profile mismatch (σcorrJ).
(analogously to Fig. 2b). The five other panels are analogous to those in Fig. 2, but in this case, the standard deviation used to normalize the difference between the extracted and the published L500 is already corrected for the effect of the profile mismatch (σcorrJ).
Current usage metrics show cumulative count of Article Views (full-text article views including HTML views, PDF and ePub downloads, according to the available data) and Abstracts Views on Vision4Press platform.
Data correspond to usage on the plateform after 2015. The current usage metrics is available 48-96 hours after online publication and is updated daily on week days.
Initial download of the metrics may take a while.