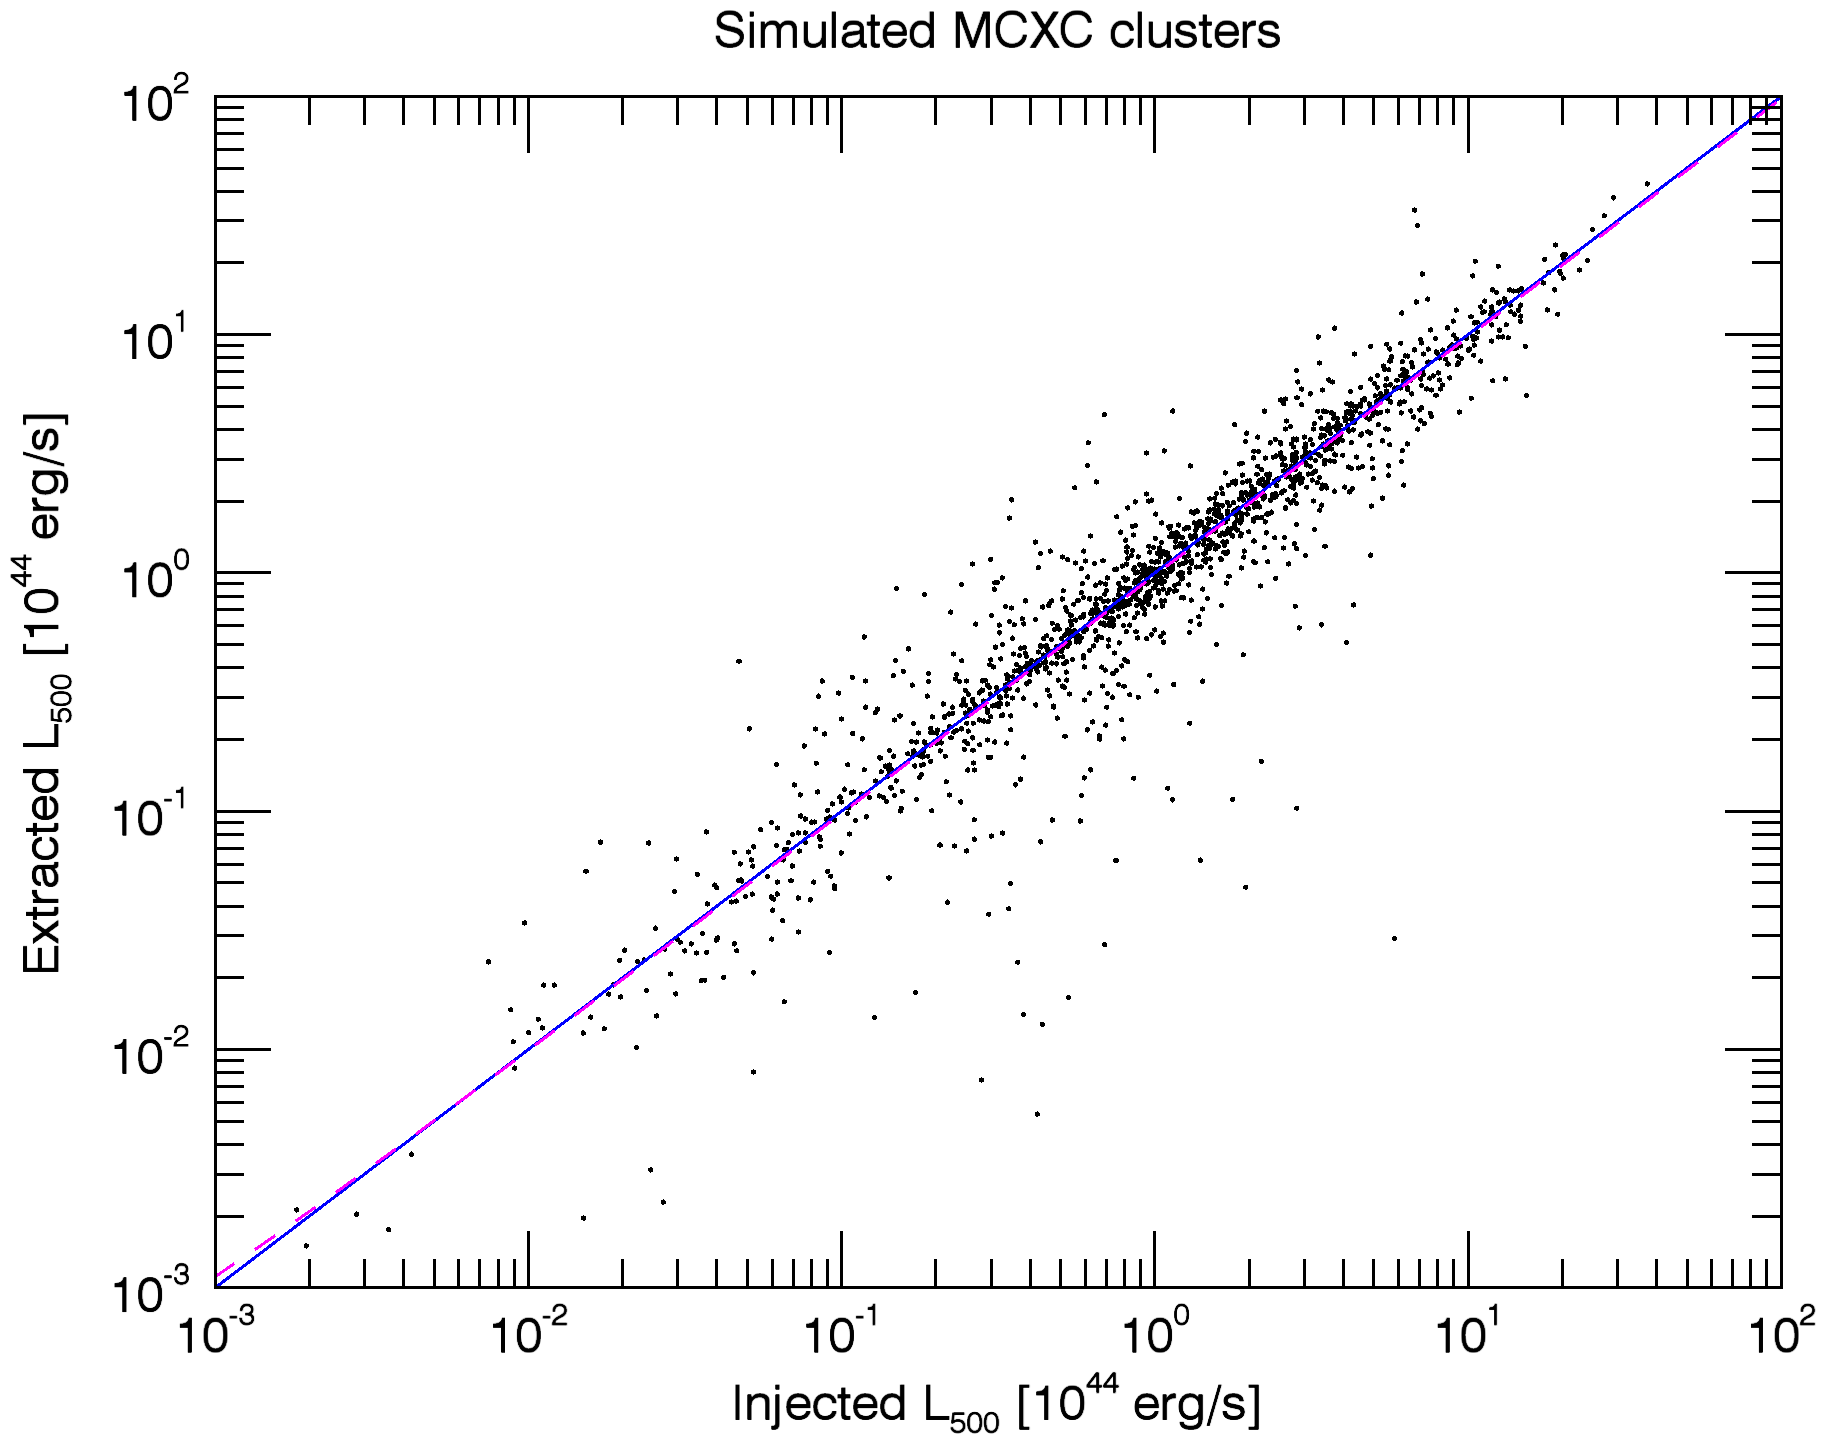
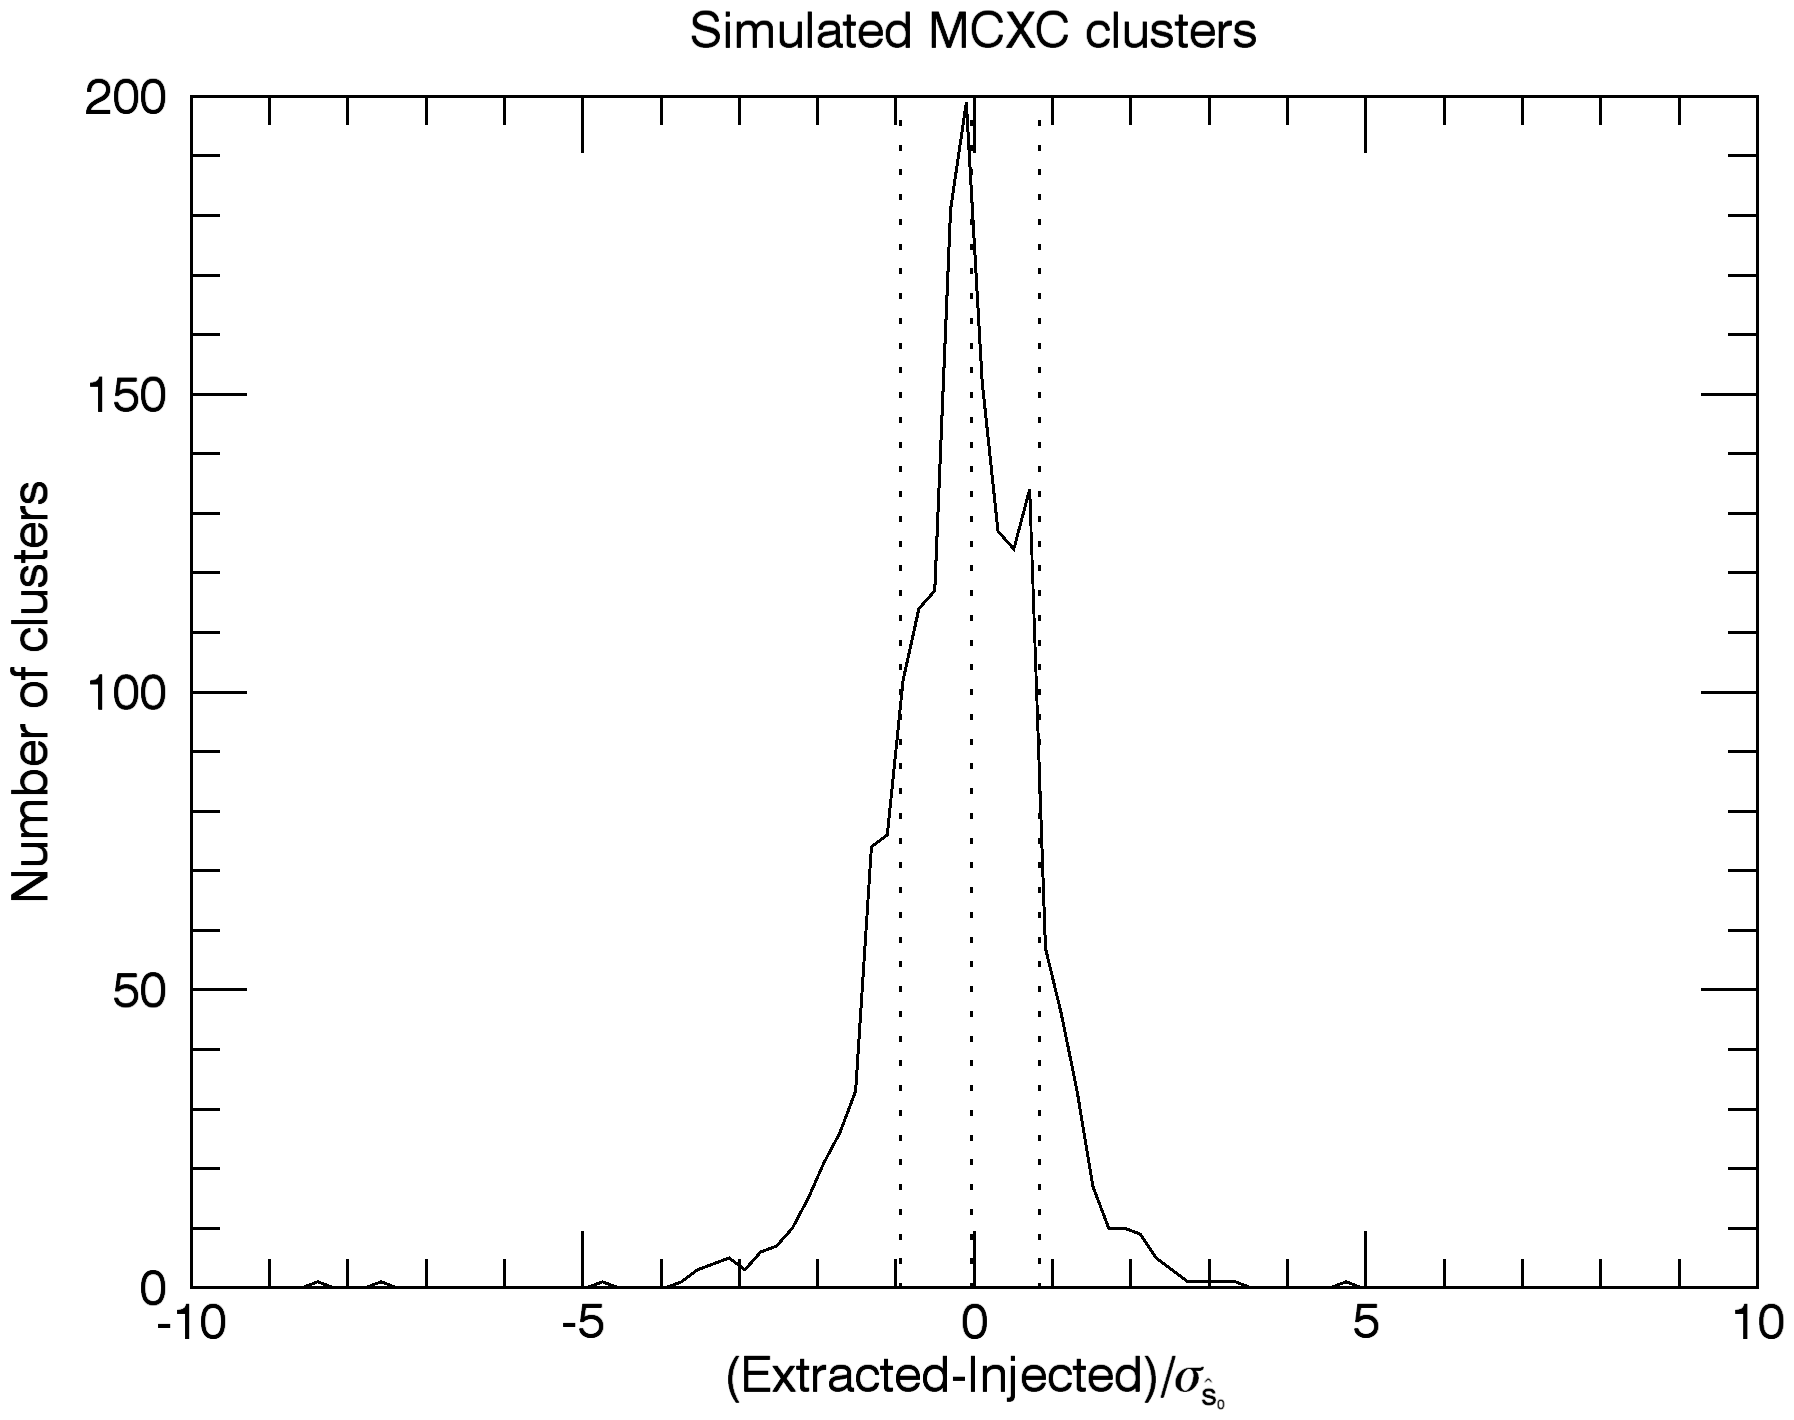
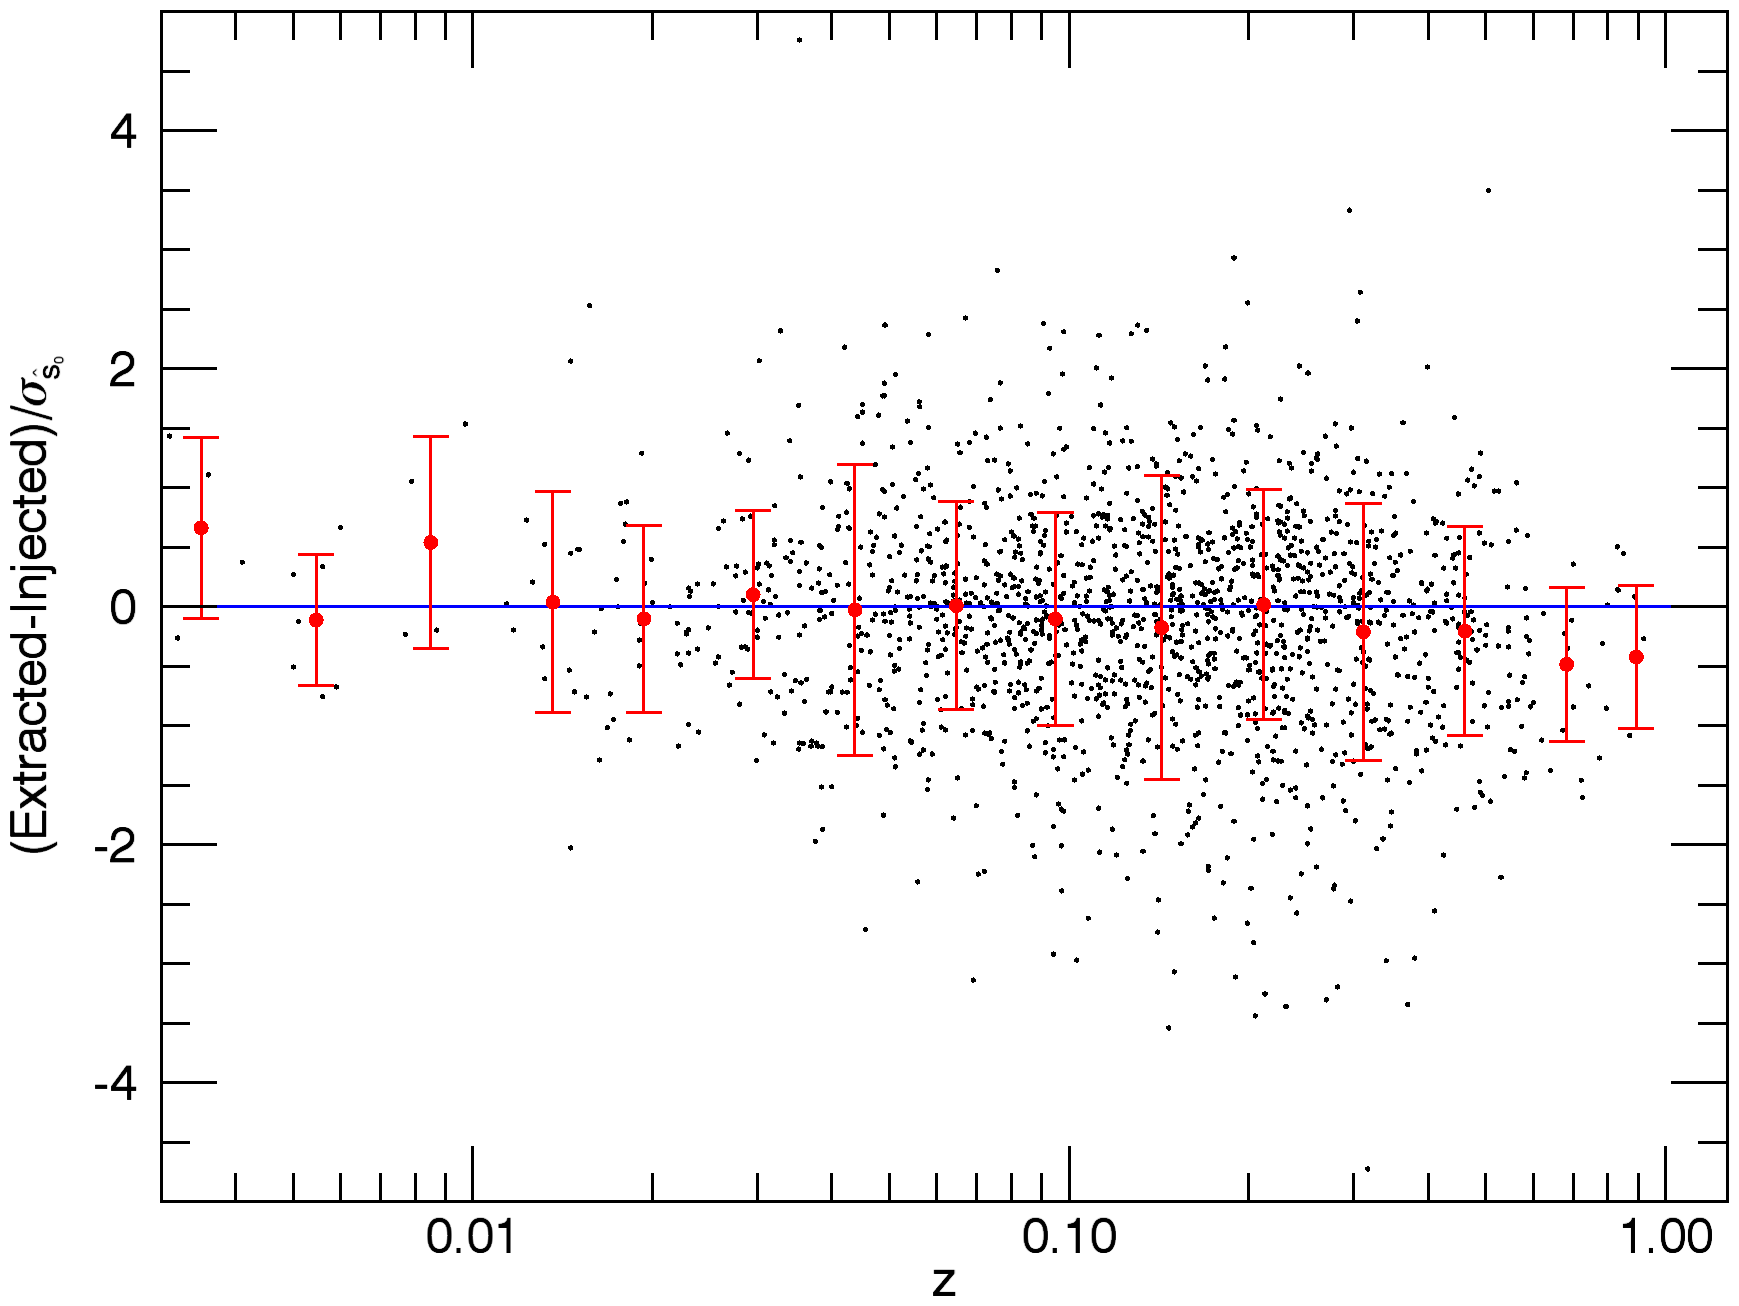
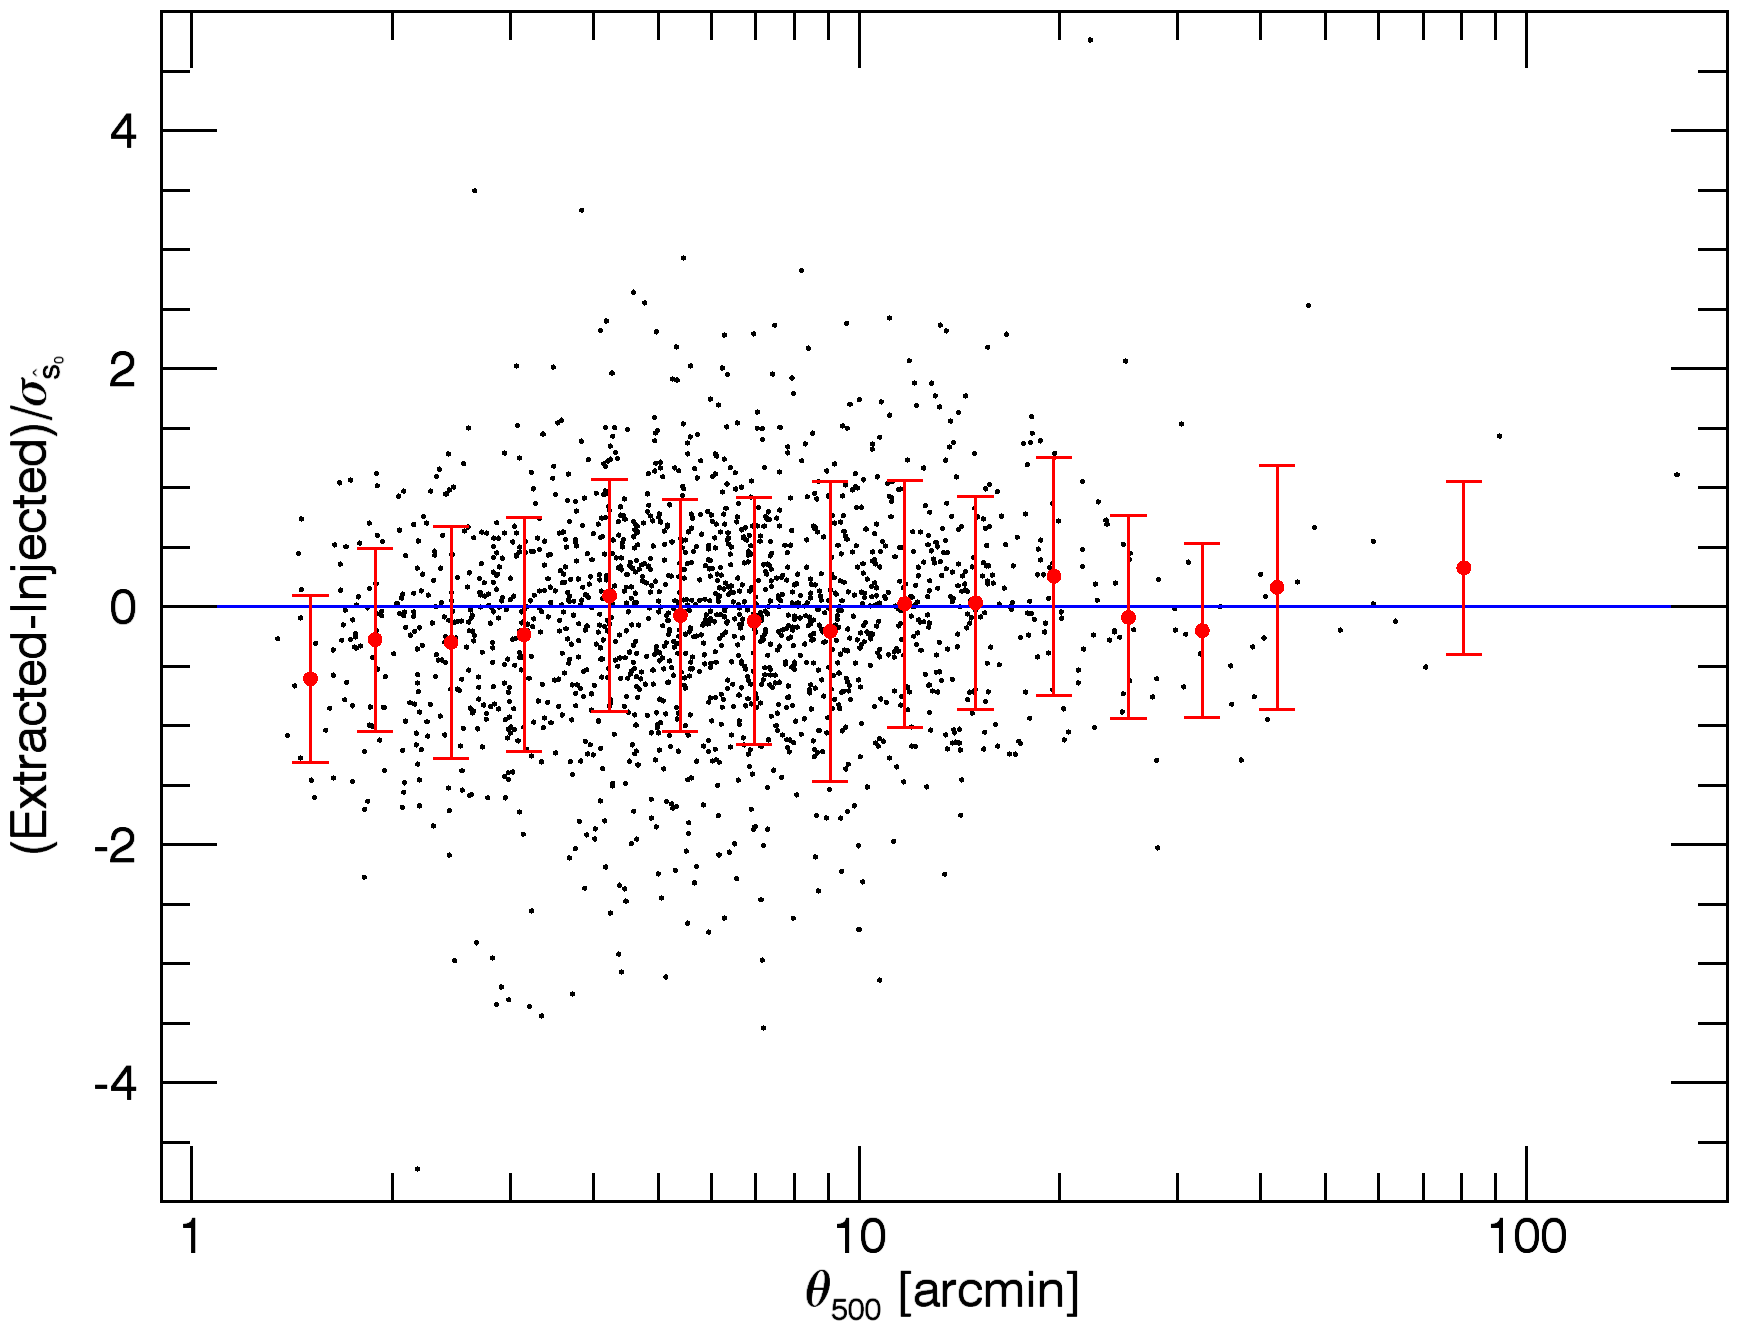
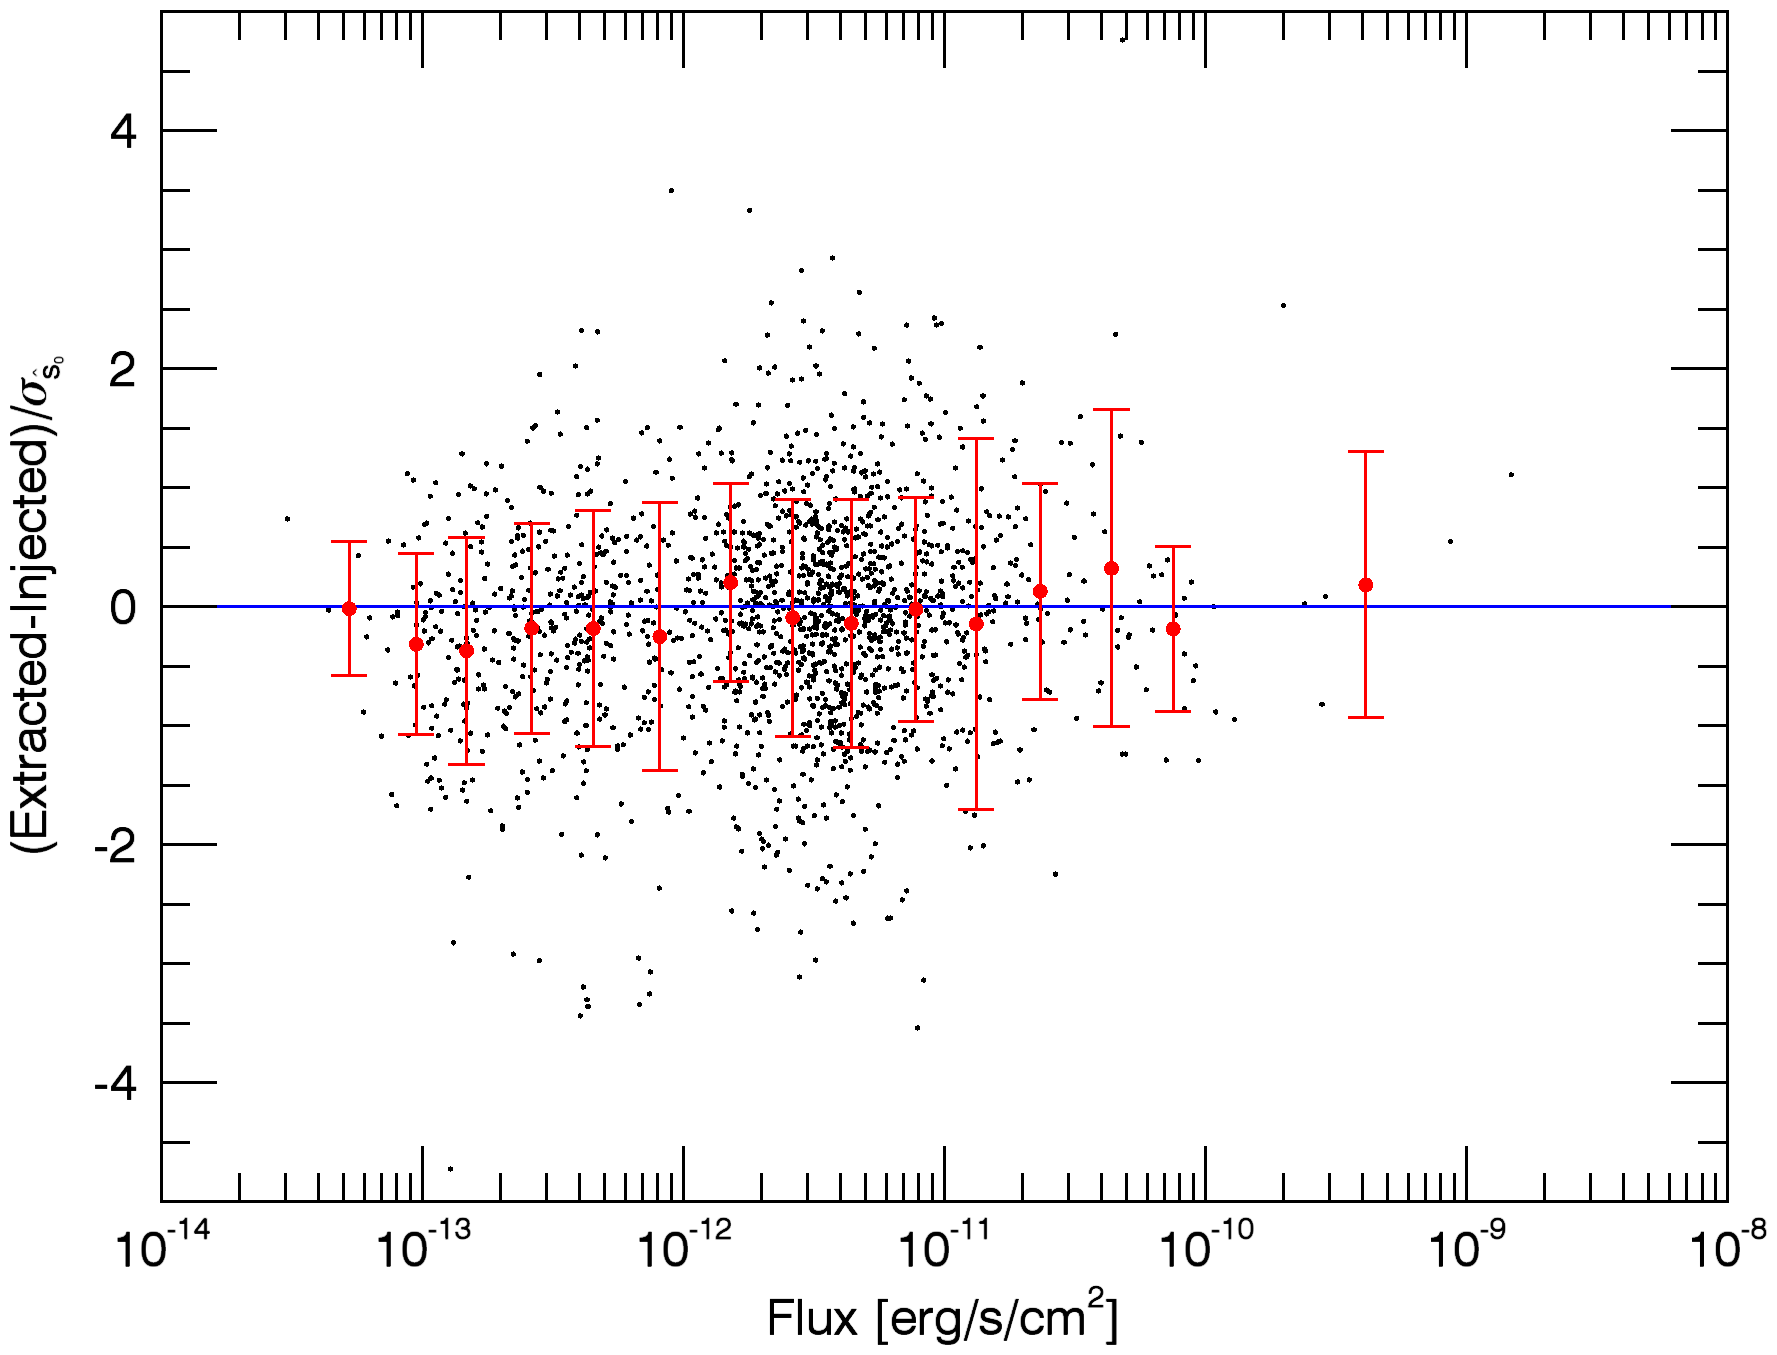
Fig. 1
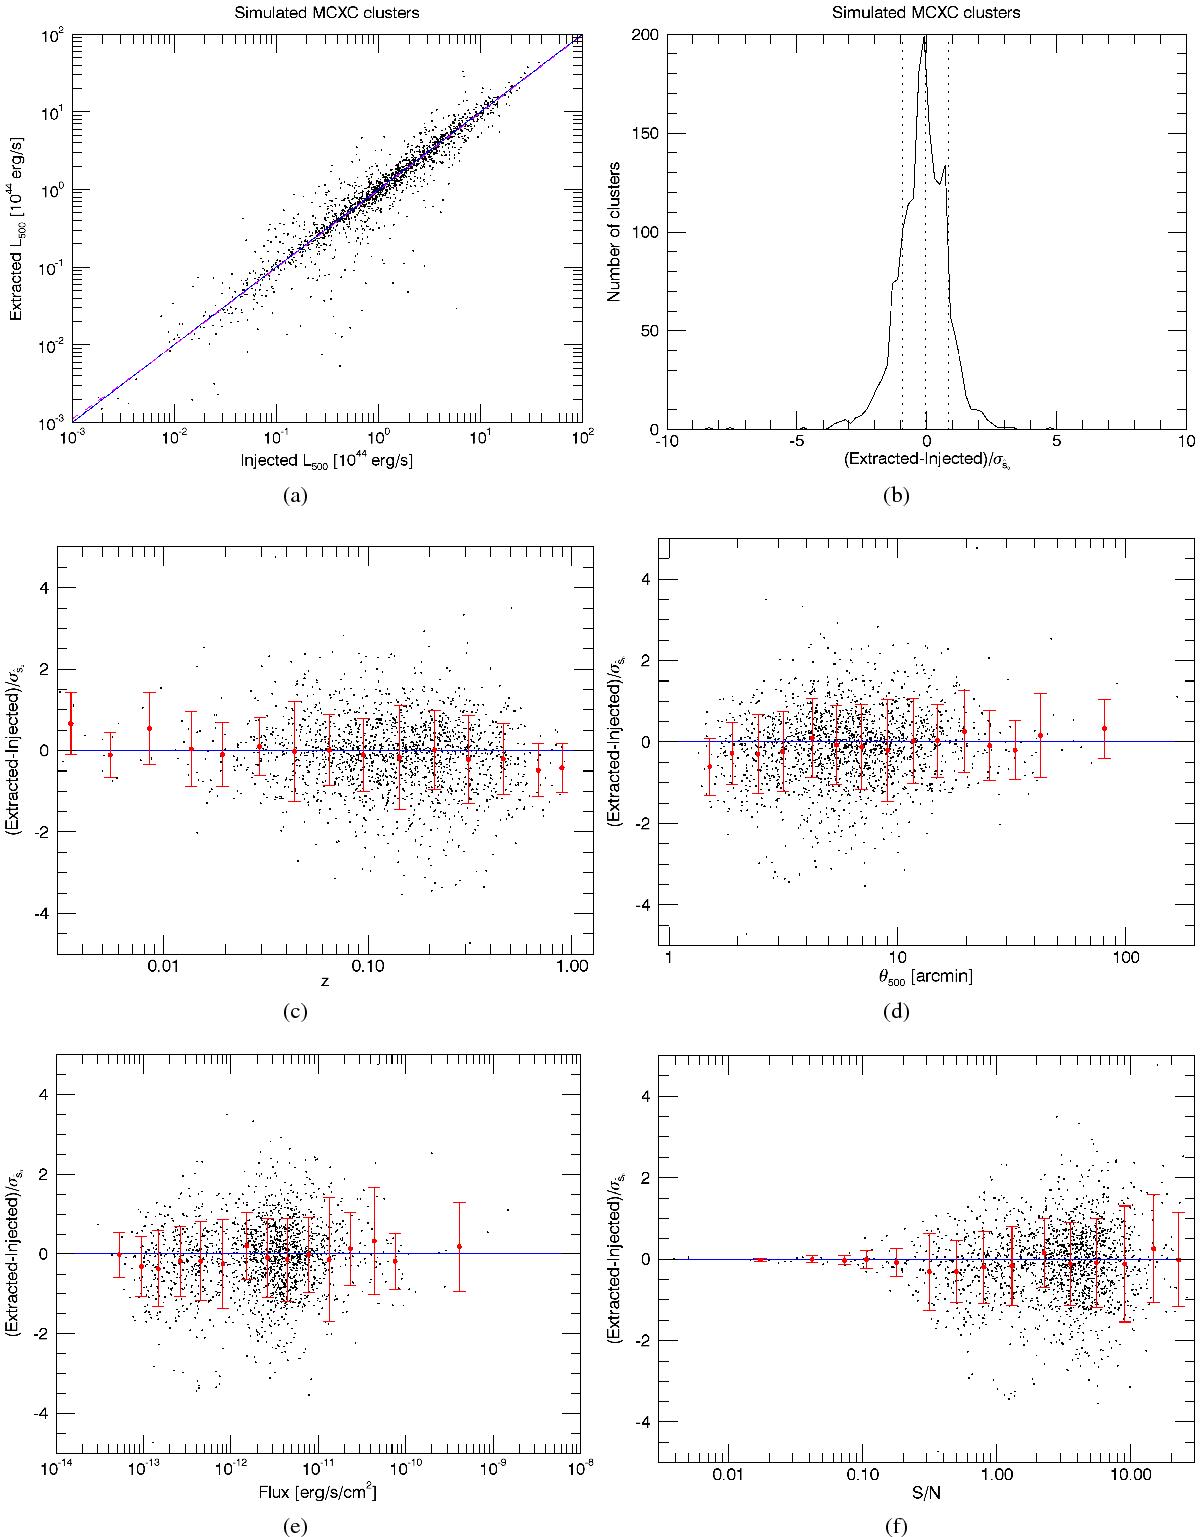
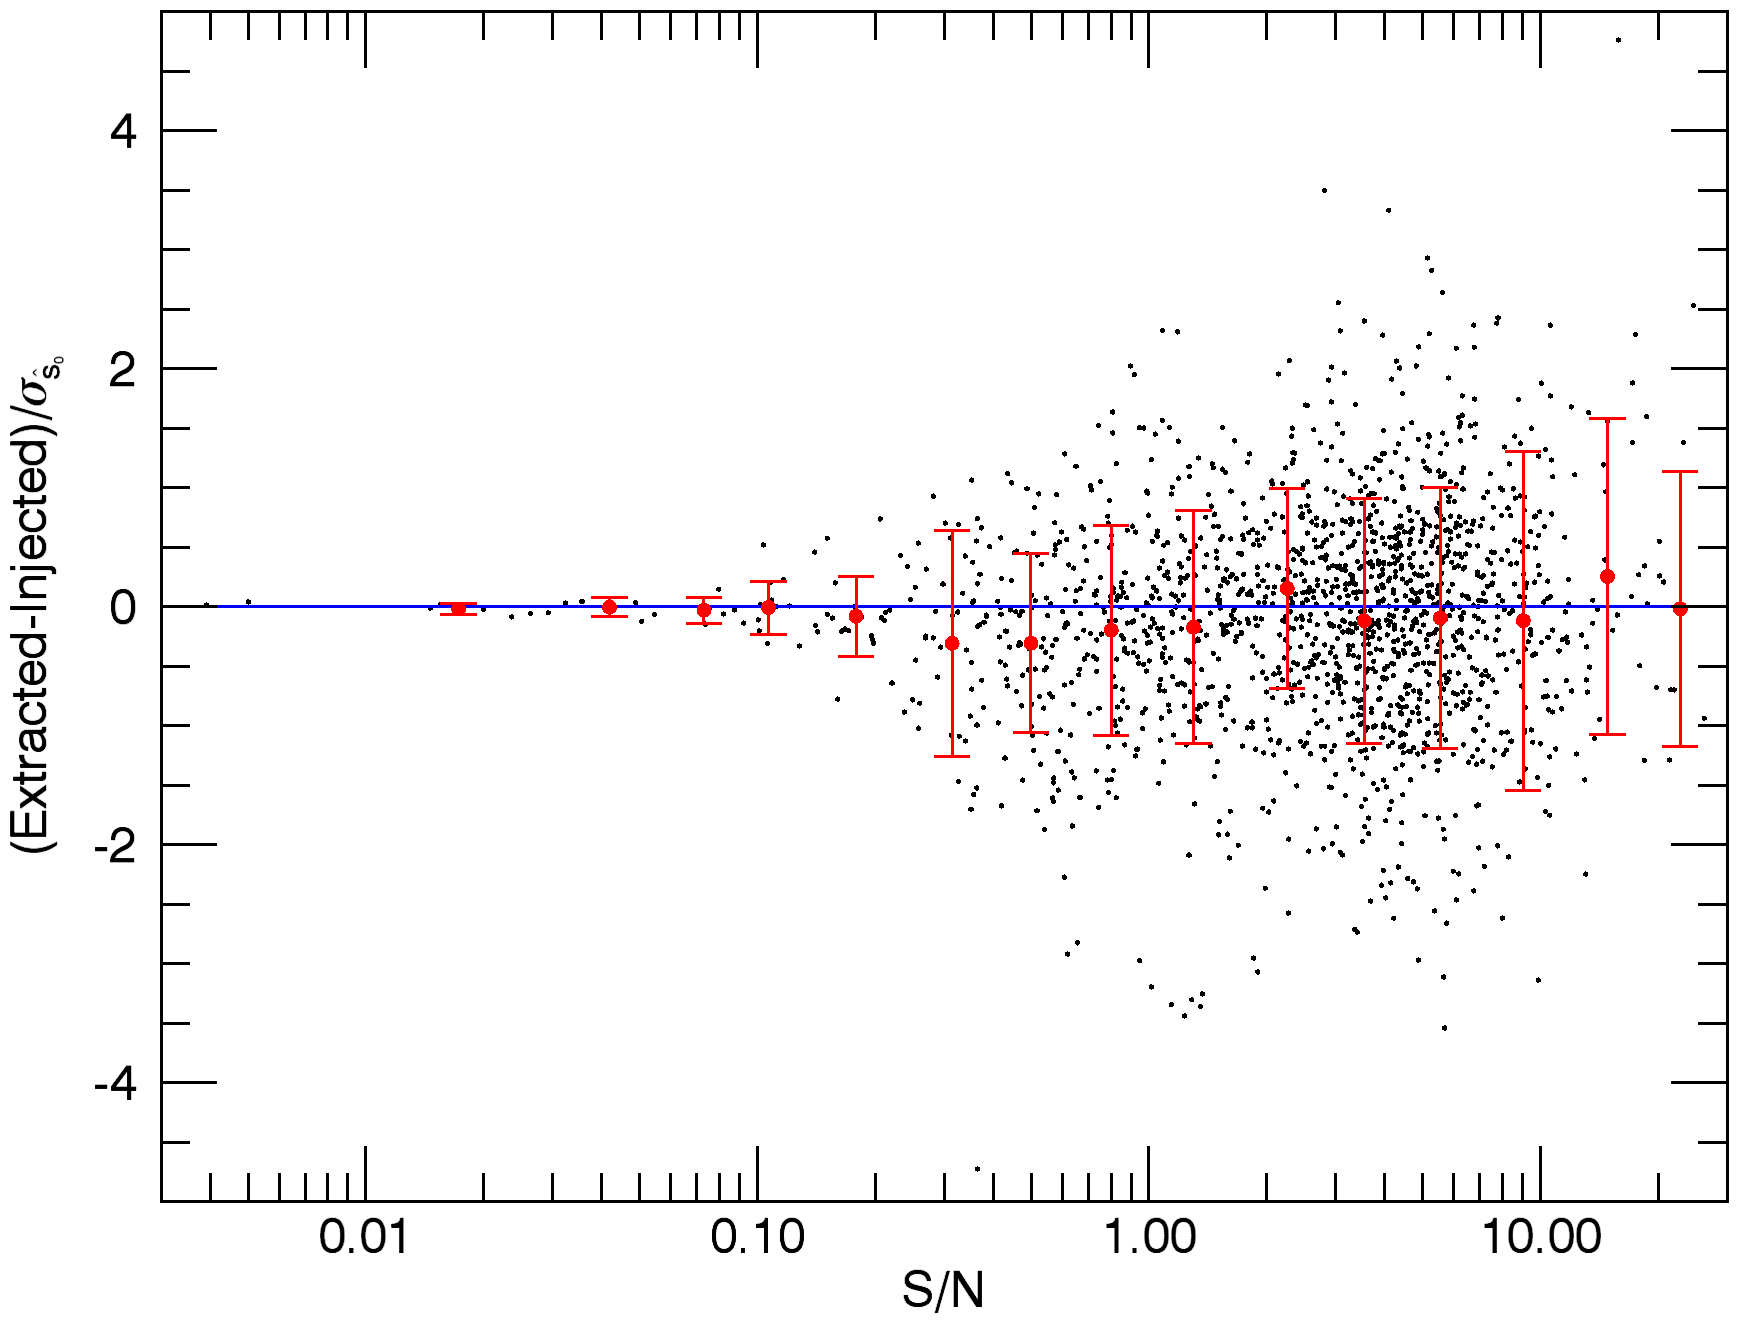
Photometry results of the extraction of simulated MCXC clusters (as described in Sect. 2.2.1) using the proposed X-ray matched filter and assuming the position and size of the clusters are known. Top left panel: extracted versus injected L500. Individual measurements are shown as black dots. The solid blue line shows the line of zero intercept and unity slope and the dashed magenta line the best linear fit to the data. Top right panel: histogram of the difference between the extracted and the injected L500, divided by the estimated ![]() (scaled to L500 units). The central vertical line shows the median value; the other two vertical lines indicate the region inside which 68% of the clusters are located. Middle and bottom panels: difference between the extracted and the injected L500, divided by the estimated
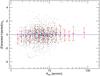
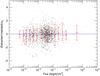
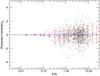
(scaled to L500 units). The central vertical line shows the median value; the other two vertical lines indicate the region inside which 68% of the clusters are located. Middle and bottom panels: difference between the extracted and the injected L500, divided by the estimated ![]() , as a function of c) the redshift; d) the size; e) the flux; and f) the S/N of each cluster (S/N is defined here as the injected signal divided by the theoretical
, as a function of c) the redshift; d) the size; e) the flux; and f) the S/N of each cluster (S/N is defined here as the injected signal divided by the theoretical ![]() ). Individual measurements are shown as black dots. The red filled circles represent the corresponding averaged values in different bins, calculated as described in the text (Sect. 2.2.2). The error bars represent the standard deviation of the values in the bin.
). Individual measurements are shown as black dots. The red filled circles represent the corresponding averaged values in different bins, calculated as described in the text (Sect. 2.2.2). The error bars represent the standard deviation of the values in the bin.
Current usage metrics show cumulative count of Article Views (full-text article views including HTML views, PDF and ePub downloads, according to the available data) and Abstracts Views on Vision4Press platform.
Data correspond to usage on the plateform after 2015. The current usage metrics is available 48-96 hours after online publication and is updated daily on week days.
Initial download of the metrics may take a while.