Fig. 6
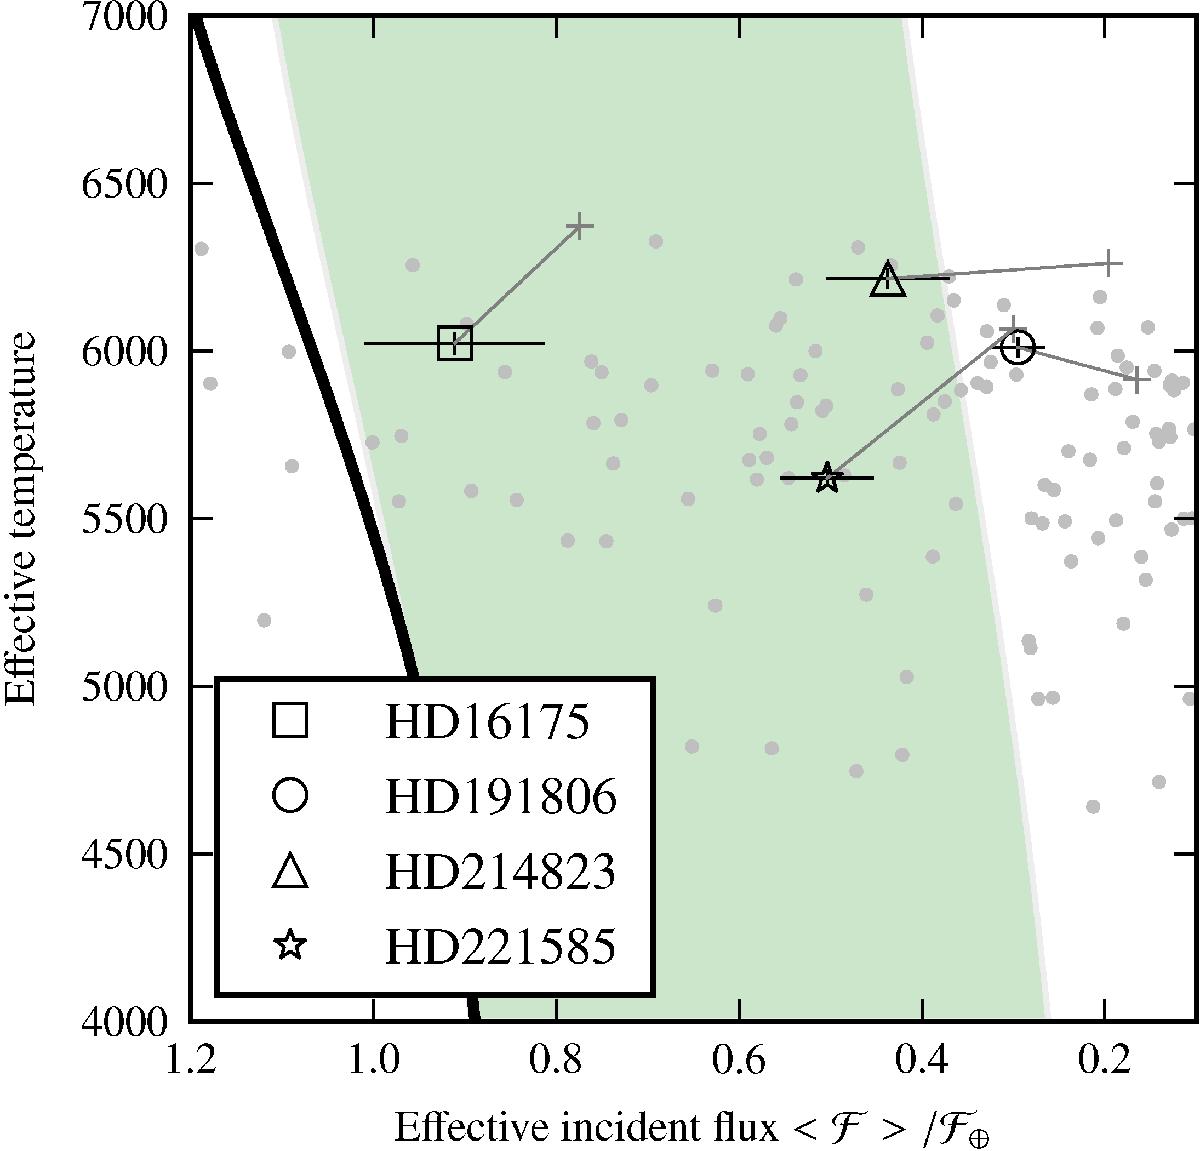
Locus of the habitable zone in the effective temperature – incident flux plane. The green filled area is delimited on the right by the maximum greenhouse limit and on the left by the moist greenhouse limit. The solid black curve represents the position of the runaway greenhouse limit. The position of the candidate planets are marked with different symbols, as indicated in the legend. The straight lines connect the current positions of the candidates with the positions they had when their host stars were 1 Gyr old (indicated by plus signs), according to the PARSEC evolution tracks (see text for detail). The grey points are giant planets (Msini> 0.1MJup) orbiting non-evolved stars (ΔMV< 2.0; Wright 2005).
Current usage metrics show cumulative count of Article Views (full-text article views including HTML views, PDF and ePub downloads, according to the available data) and Abstracts Views on Vision4Press platform.
Data correspond to usage on the plateform after 2015. The current usage metrics is available 48-96 hours after online publication and is updated daily on week days.
Initial download of the metrics may take a while.