Fig. 5
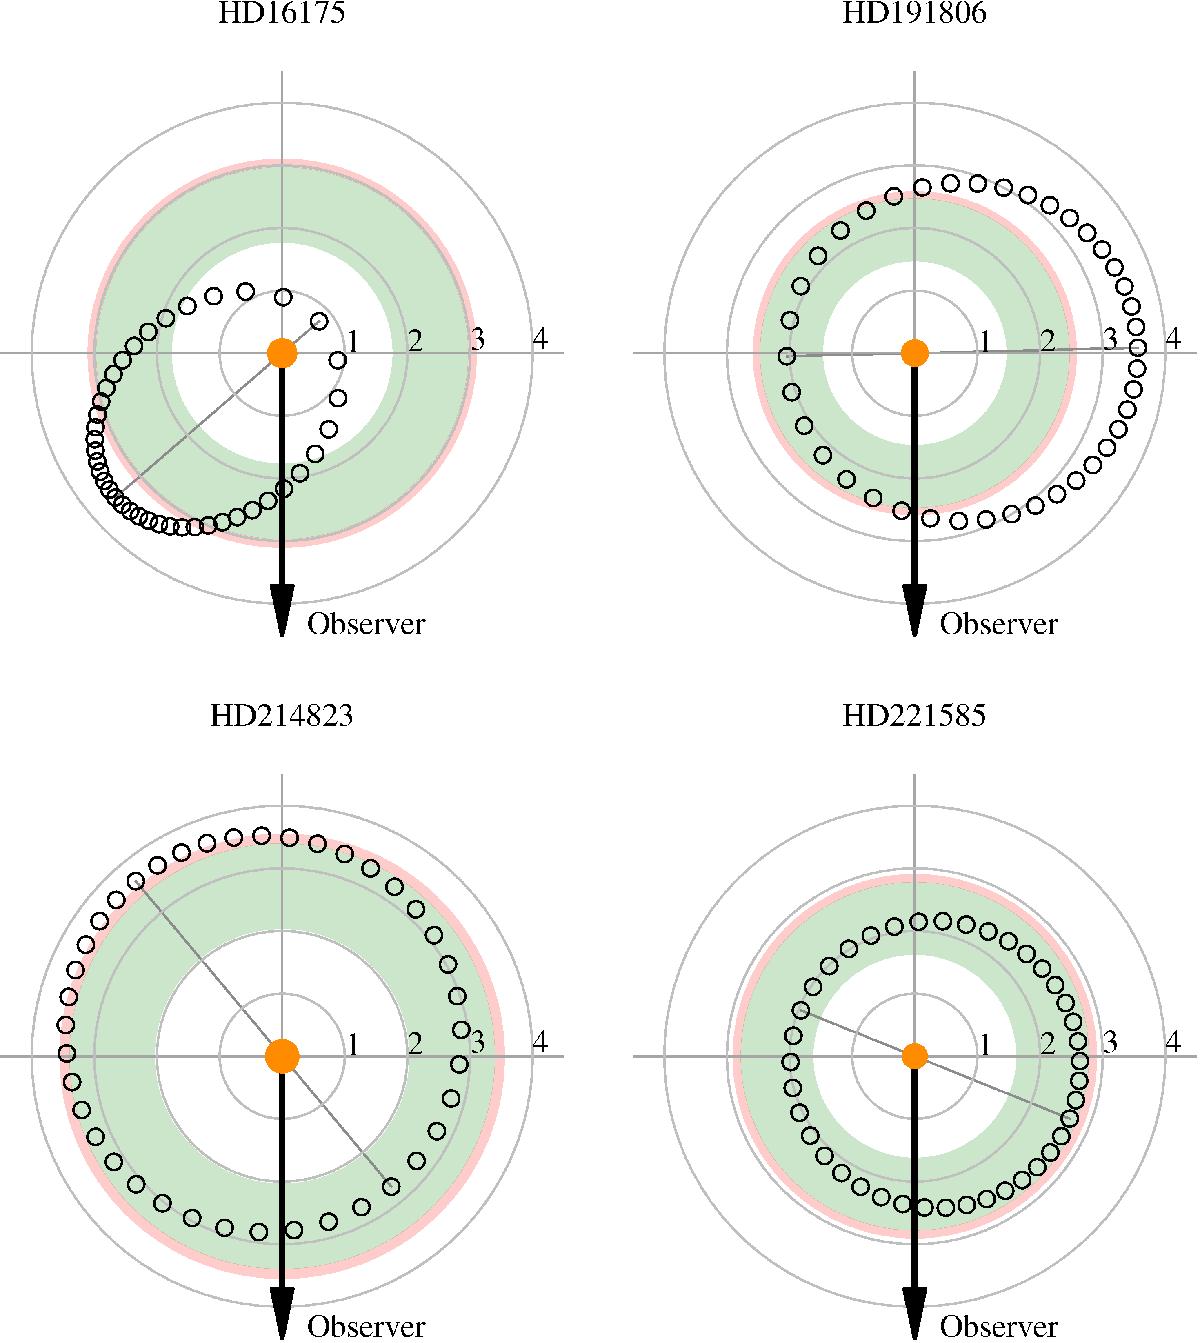
Schematic view of the systems. The orbital plane is represented. The maximum a posteriori companion orbits are indicated with the empty black points that are equally spaced in time over the orbit. The orbital movement is counter-clockwise and angles are measured counter-clockwise from the negative x-axis. The semi-major axis of the orbit is shown as a thin grey line. The host star is at the centre and the area of the orange circle is proportional to its luminosity. The concentric circles are labelled in astronomical units and the black thick arrow points towards the observer. The filled green area is the habitable zone comprised between the “runaway greenhouse” limit and the “maximum greenhouse” limit, according to the model of Kopparapu et al. (2013b). The red area corresponds to the increased habitable zone if the outer edge is defined by the “early Mars” limit.
Current usage metrics show cumulative count of Article Views (full-text article views including HTML views, PDF and ePub downloads, according to the available data) and Abstracts Views on Vision4Press platform.
Data correspond to usage on the plateform after 2015. The current usage metrics is available 48-96 hours after online publication and is updated daily on week days.
Initial download of the metrics may take a while.