Fig. 3
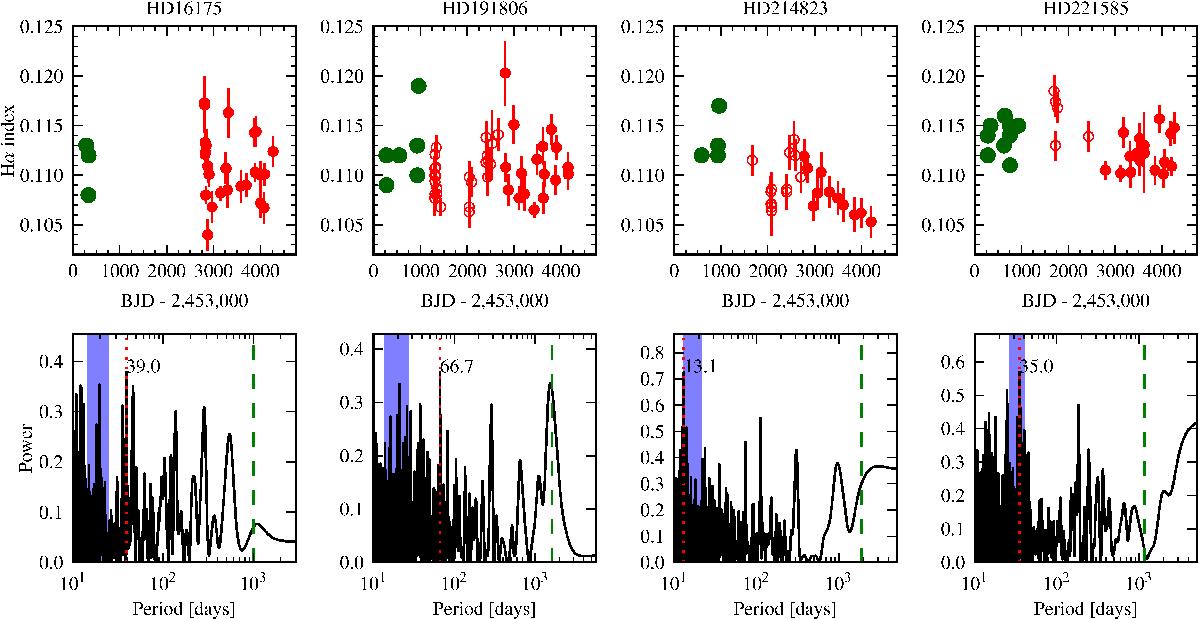
Top row: time series of the Hα activity index. The green points correspond to ELODIE observations, and red empty symbols and red filled symbols are for SOPHIE and SOPHIE+, respectively. The same scale is used for all stars to ease comparison. Bottom row: generalised Lomb-Scargle periodogram for the SOPHIE and SOPHIE+ Hα index. It was assumed that no offset exists between the index measurement of SOPHIE and SOPHIE+. The red vertical dotted lines signal the position of the highest peaks whose periods are annotated, the blue shaded areas represent the 2σ intervals for the stellar rotational periods listed in Table 2, and the green vertical dashed lines corresponds to the maximum a posteriori orbital period of the orbiting companions.
Current usage metrics show cumulative count of Article Views (full-text article views including HTML views, PDF and ePub downloads, according to the available data) and Abstracts Views on Vision4Press platform.
Data correspond to usage on the plateform after 2015. The current usage metrics is available 48-96 hours after online publication and is updated daily on week days.
Initial download of the metrics may take a while.