Fig. 13
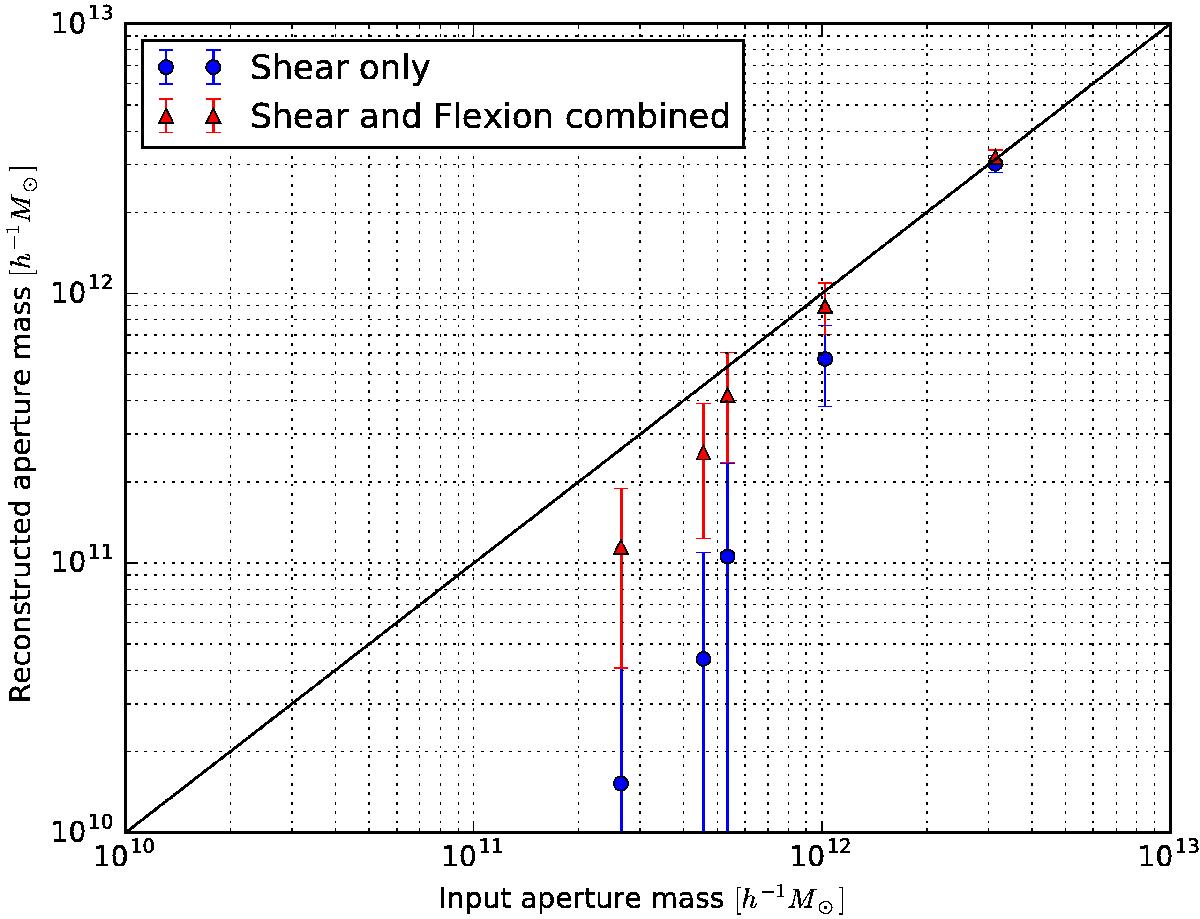
Aperture mass for the main subhalo in field 1 for five different radii: 19, 38, 75, 150, and 300 h-1 kpc or 6′′, 12′′, 24′′, 48′′, and 1.6′. The blue circles indicate the masses computed on the shear only reconstructions while the red triangles indicate the masses computed on the combined shear and flexion reconstructions. Error bars represent the standard deviation of 100 independent realisations.
Current usage metrics show cumulative count of Article Views (full-text article views including HTML views, PDF and ePub downloads, according to the available data) and Abstracts Views on Vision4Press platform.
Data correspond to usage on the plateform after 2015. The current usage metrics is available 48-96 hours after online publication and is updated daily on week days.
Initial download of the metrics may take a while.