Free Access
Fig. 9
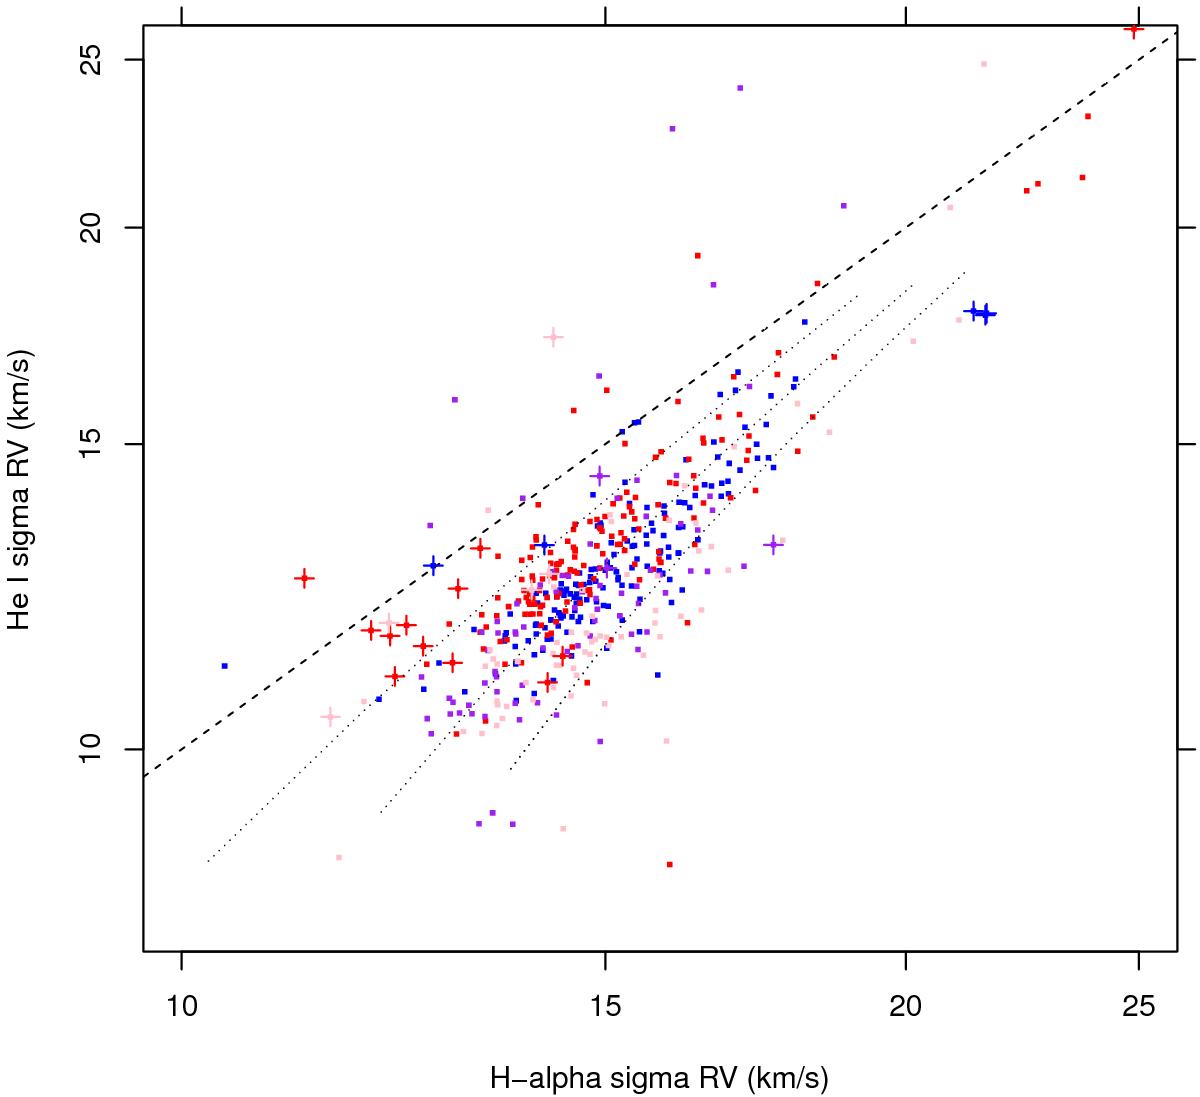
Gaussian widths σ of He I lines vs. those of Hα. The three dotted lines represent loci of constant gas temperature Tgas = 5000,10 000,15 000 from top to bottom. The dashed line represents equality. Symbols as in Fig. 7. Only datapoints with the same RV from Hα and He I within 3 km s-1 are shown.
Current usage metrics show cumulative count of Article Views (full-text article views including HTML views, PDF and ePub downloads, according to the available data) and Abstracts Views on Vision4Press platform.
Data correspond to usage on the plateform after 2015. The current usage metrics is available 48-96 hours after online publication and is updated daily on week days.
Initial download of the metrics may take a while.