Free Access
Fig. 6
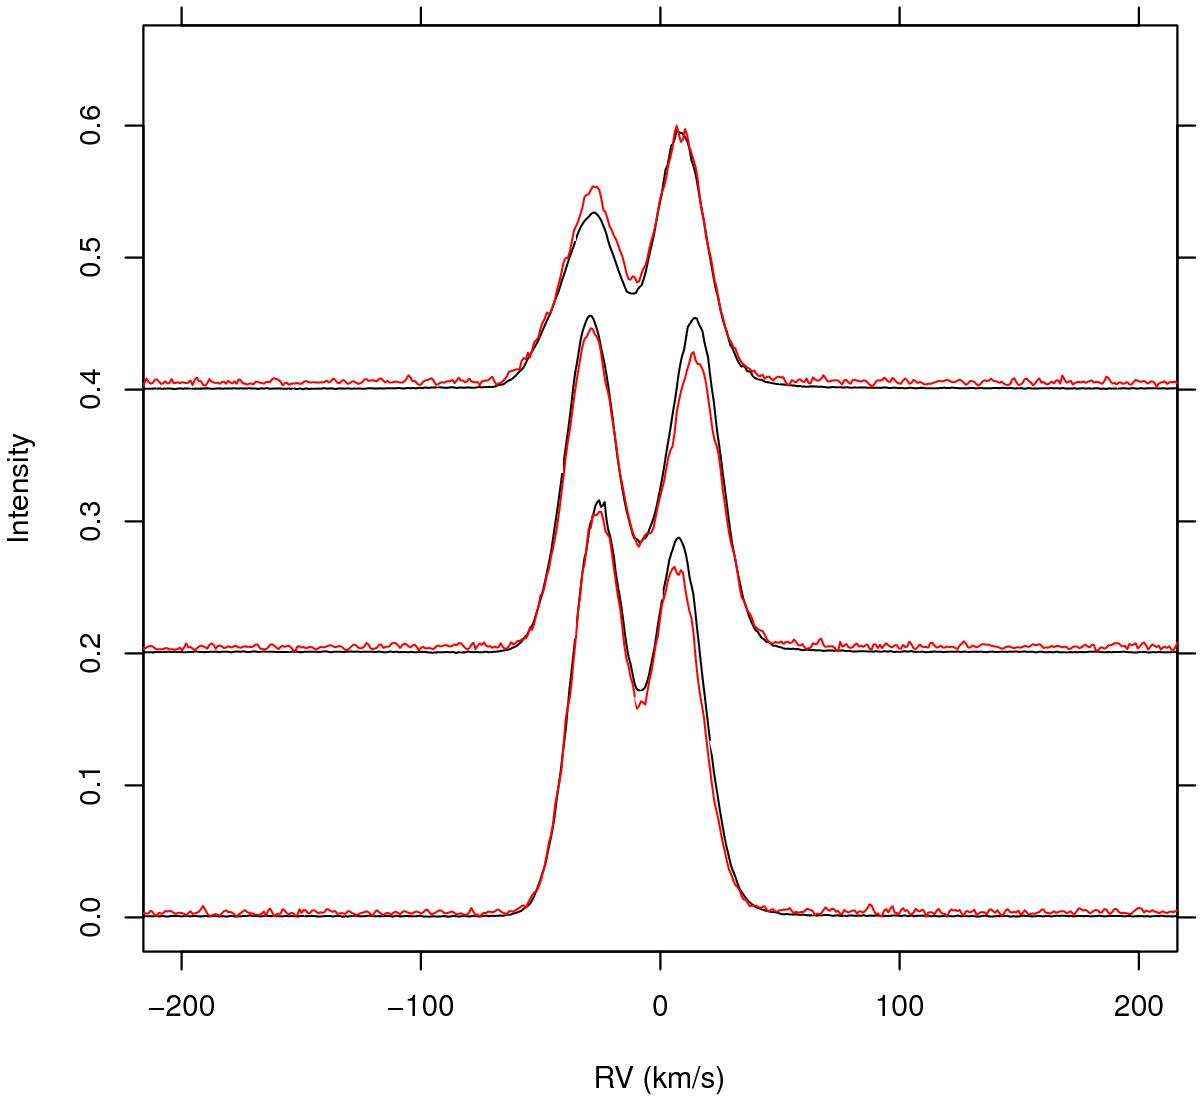
Examples of Hβ (red) and Hα (black) lines from pure-sky fibers using UVES. A vertical shift was applied to spectra from different sky positions. The Hβ lines were scaled up by a factor of 7.
Current usage metrics show cumulative count of Article Views (full-text article views including HTML views, PDF and ePub downloads, according to the available data) and Abstracts Views on Vision4Press platform.
Data correspond to usage on the plateform after 2015. The current usage metrics is available 48-96 hours after online publication and is updated daily on week days.
Initial download of the metrics may take a while.