Fig. A.1
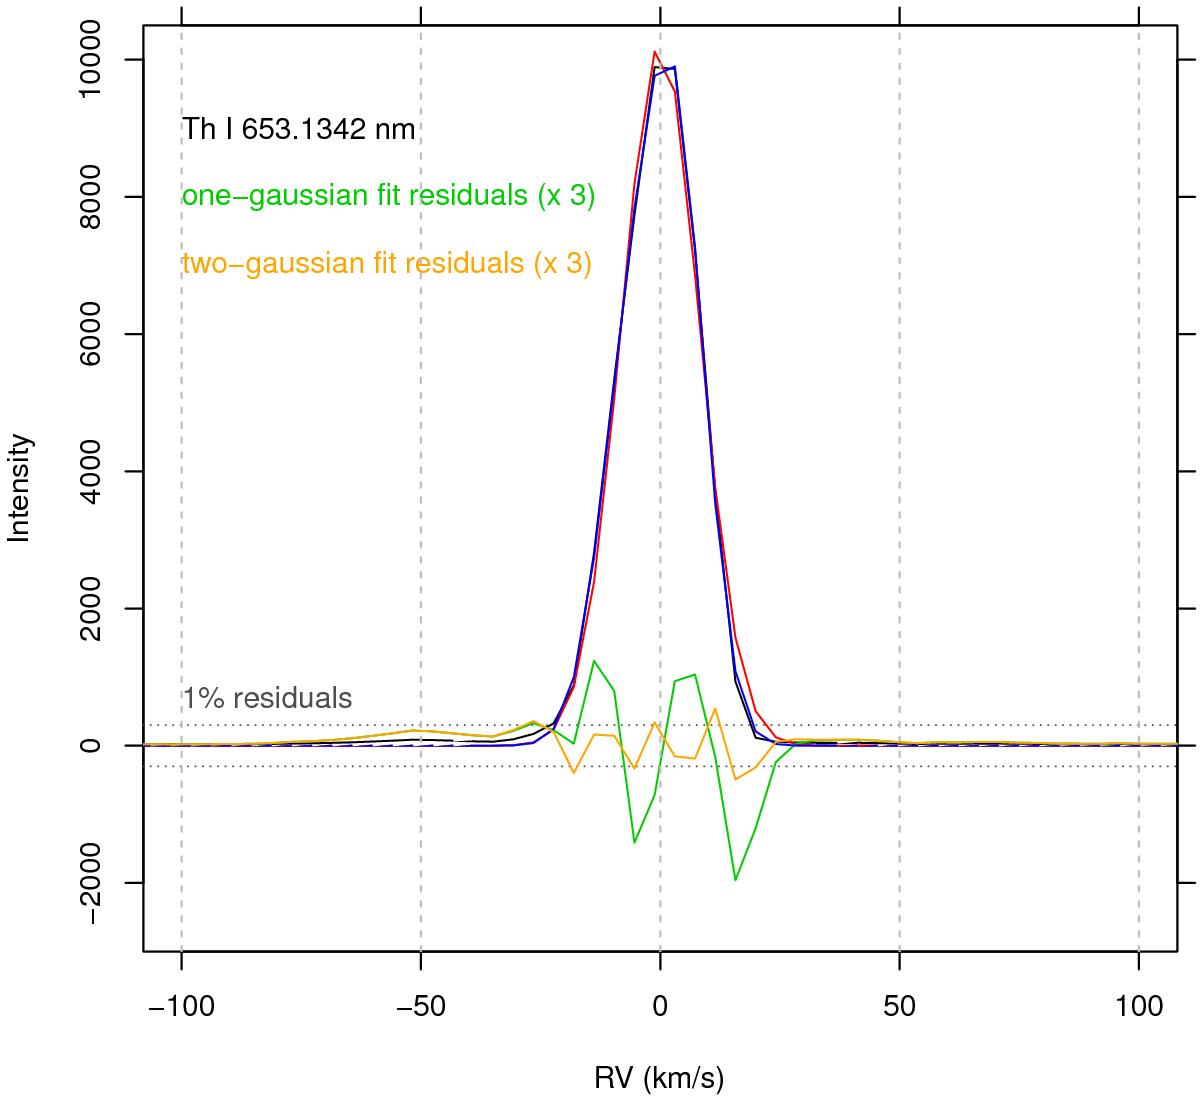
Giraffe HR15N Th–Ar lamp line (black), and best-fit one-Gaussian (red) and two-Gaussian (blue) models. To facilitate comparison with earlier results the abscissa is shown on a velocity scale. Best-fit residuals, scaled up three times, are shown in green and orange for the one- and two-Gaussian models, respectively. The vertical dashed gray lines correspond to those shown in Fig. 17; the horizontal dotted lines indicate amplitudes in the residuals of ± 1% of peak, like the horizontal lines in Fig. 17.
Current usage metrics show cumulative count of Article Views (full-text article views including HTML views, PDF and ePub downloads, according to the available data) and Abstracts Views on Vision4Press platform.
Data correspond to usage on the plateform after 2015. The current usage metrics is available 48-96 hours after online publication and is updated daily on week days.
Initial download of the metrics may take a while.