Fig. 41
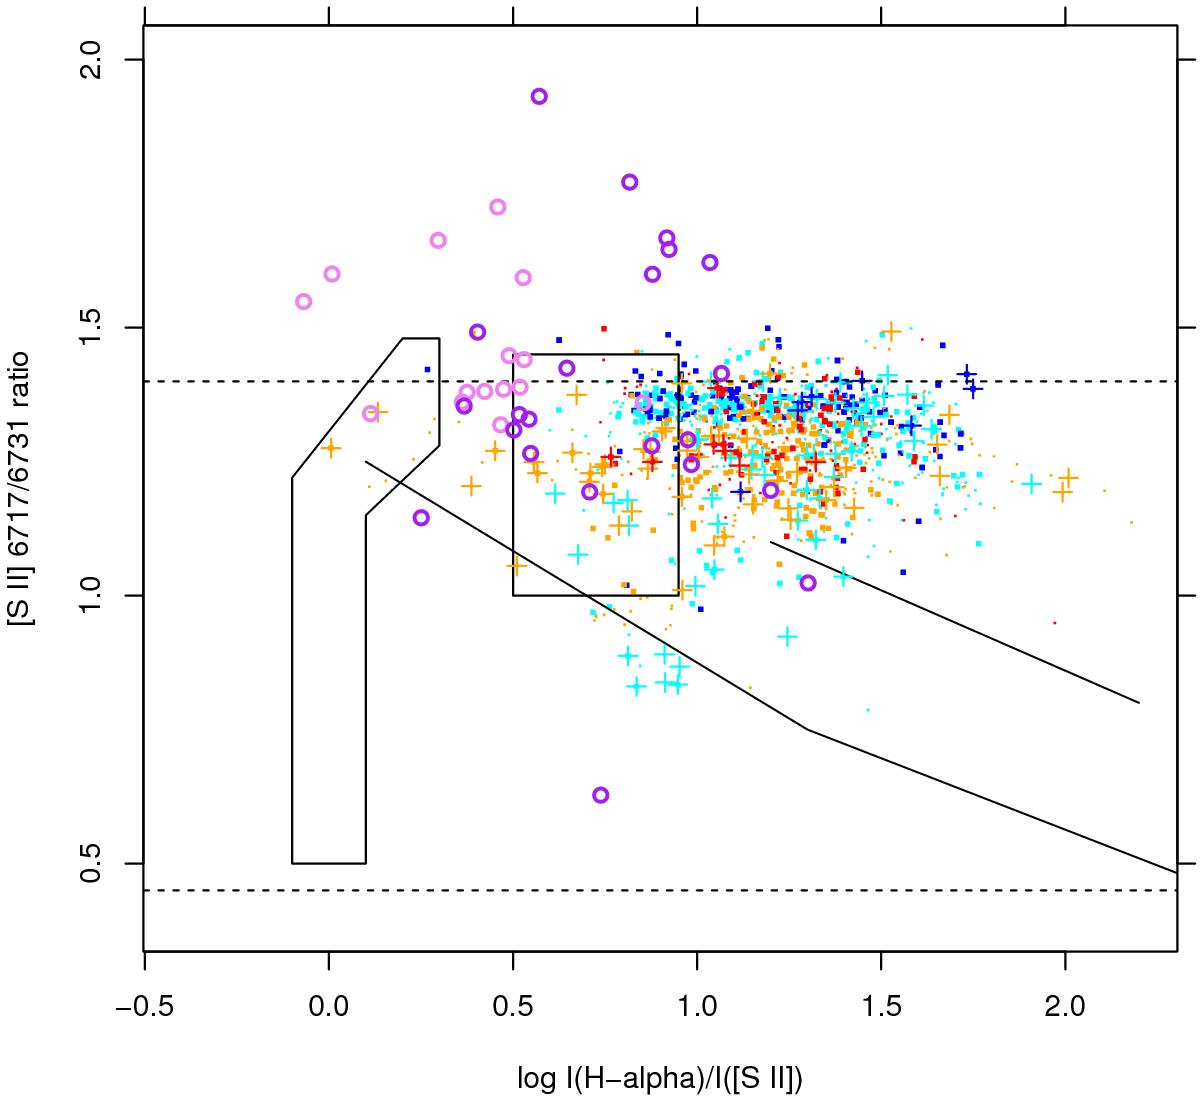
[S II] λλ 6717/6731 intensity ratio vs. Hα/[S II] ratio. Circles refer to intensity ratios in the narrow wings of [S II] and Hα, when present (violet: approaching component; purple: receding component). Other symbols are as in Fig. 12. Solid lines/polygons indicate SNR, H II, and PNe loci as in Fig. 40. Dashed horizontal lines enclose the range where the [S II] 6717/6731 ratio is a useful measure of density (increasing from top to bottom).
Current usage metrics show cumulative count of Article Views (full-text article views including HTML views, PDF and ePub downloads, according to the available data) and Abstracts Views on Vision4Press platform.
Data correspond to usage on the plateform after 2015. The current usage metrics is available 48-96 hours after online publication and is updated daily on week days.
Initial download of the metrics may take a while.