Fig. 4
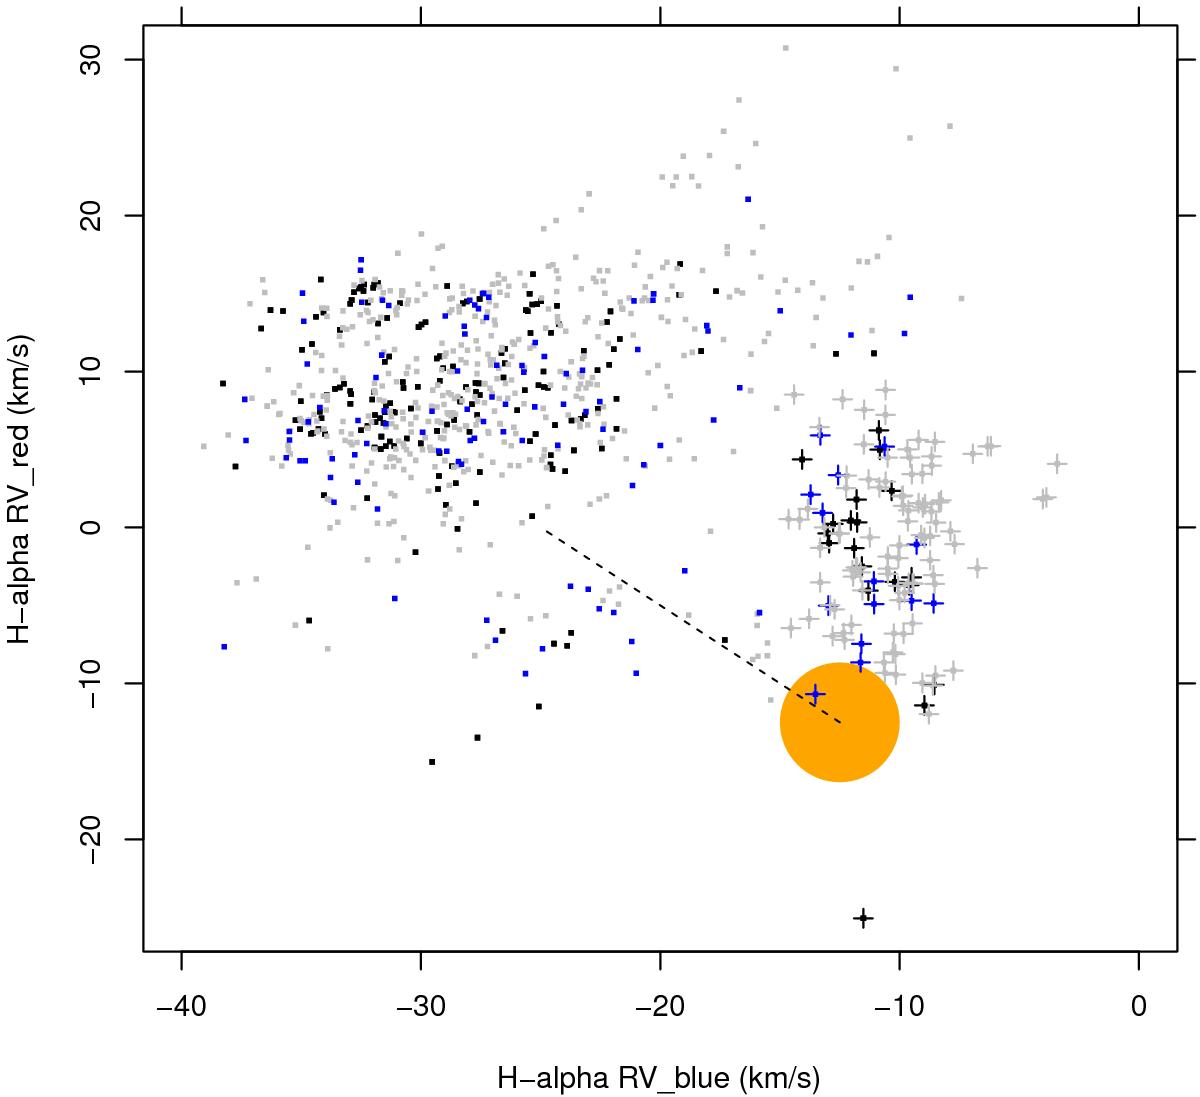
Radial velocity of the receding component vs. RV of the approaching component. Here the black dots refer to pure-sky fibers from the HR15N setup, blue dots to pure-sky from the HR14A setup, and gray dots to sky lines from faint stars. The orange circles represent the average RV of low-mass cluster stars. The dashed line is the expected locus for purely spherical expansion. A subsample of apparently peculiar datapoints is highlighted using “+” symbols.
Current usage metrics show cumulative count of Article Views (full-text article views including HTML views, PDF and ePub downloads, according to the available data) and Abstracts Views on Vision4Press platform.
Data correspond to usage on the plateform after 2015. The current usage metrics is available 48-96 hours after online publication and is updated daily on week days.
Initial download of the metrics may take a while.