Fig. 25
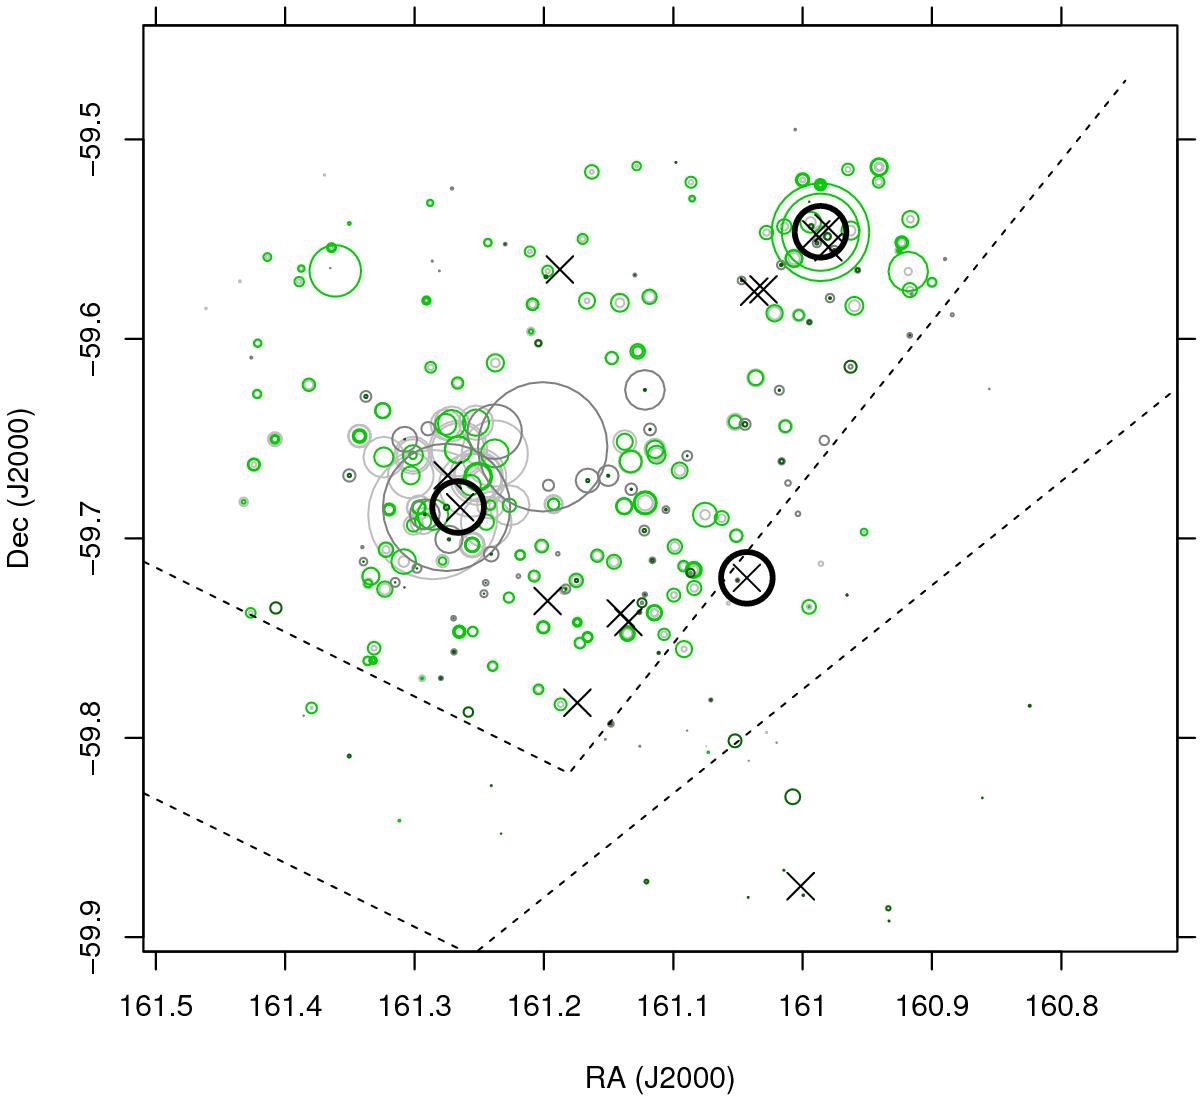
Map of the distribution of intensity in the wide Hα wings (gray) and sky continuum emission (green). Circle size is proportional to intensity. Darker gray circles indicate data from pure-sky fibers using HR14A setup. Thick circles and crosses have the same meaning as in Fig. 23. The large gray circle closest to the center indicates the very intense Hα wings in the direction of the Keyhole Nebula.
Current usage metrics show cumulative count of Article Views (full-text article views including HTML views, PDF and ePub downloads, according to the available data) and Abstracts Views on Vision4Press platform.
Data correspond to usage on the plateform after 2015. The current usage metrics is available 48-96 hours after online publication and is updated daily on week days.
Initial download of the metrics may take a while.