Fig. 23
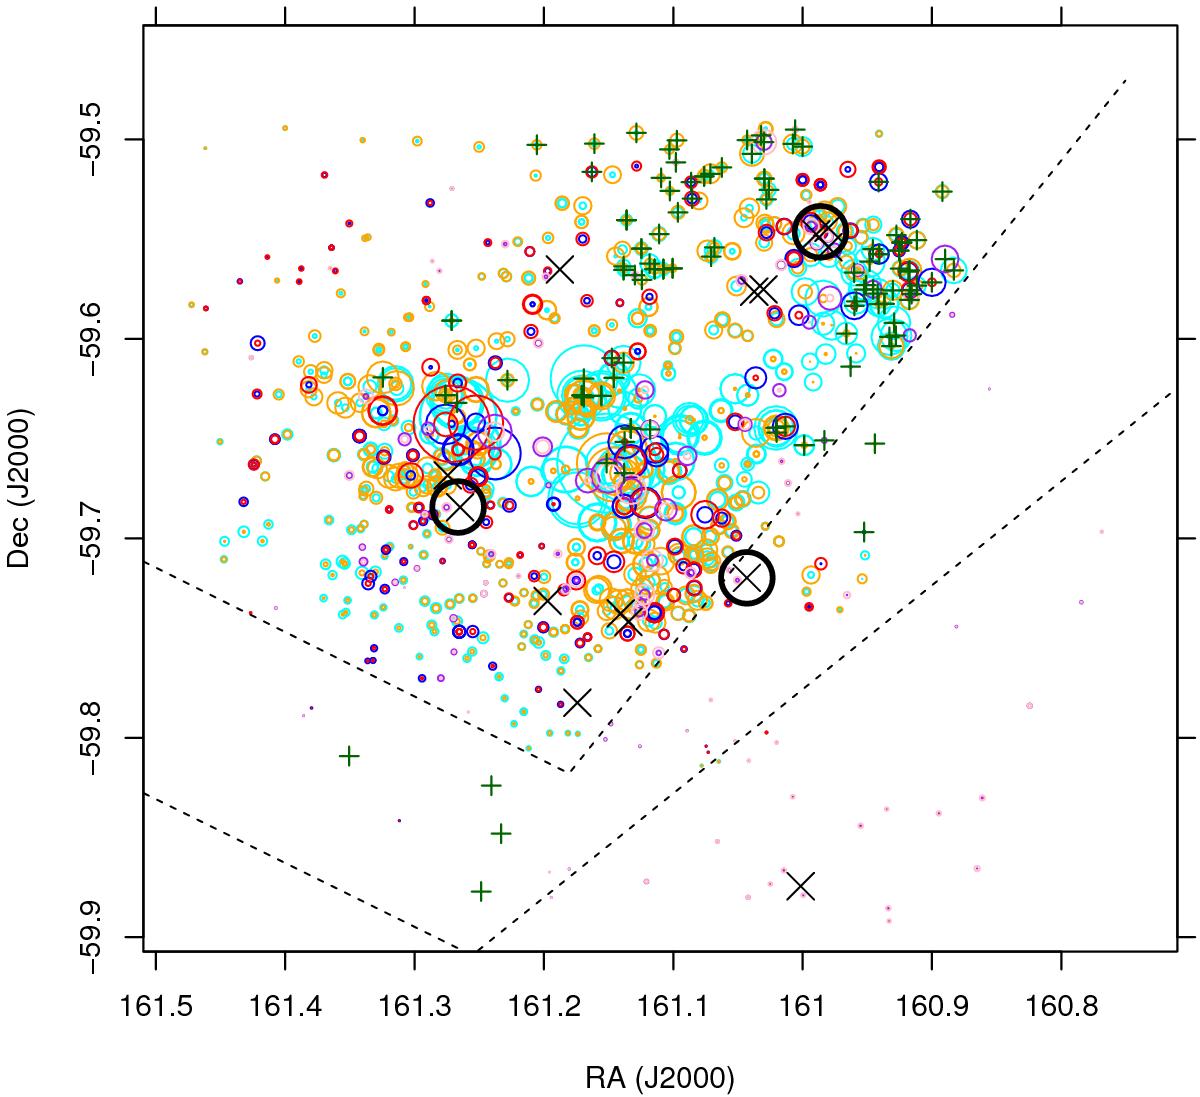
Spatial map of Hα line intensity (fit normalization). The radius of each circle is proportional to intensity. Blue (cyan, purple) circles refer to the approaching component, while red (orange, pink) circles refer to the receding component. The circles are color-coded as in Figs. 7 and 12. The oblique dashed lines outline the edges of the absorption lanes visible in Fig. 1. Crosses indicate the positions of O/WR stars from Walborn (1973). The large black circles indicate the positions of Trumpler 14 (upper), η Car (middle left), and the Wolf-Rayet star WR25 (middle right). The green “+” symbols indicate the positions of zero-velocity gas (see Fig. 4).
Current usage metrics show cumulative count of Article Views (full-text article views including HTML views, PDF and ePub downloads, according to the available data) and Abstracts Views on Vision4Press platform.
Data correspond to usage on the plateform after 2015. The current usage metrics is available 48-96 hours after online publication and is updated daily on week days.
Initial download of the metrics may take a while.