Fig. 18
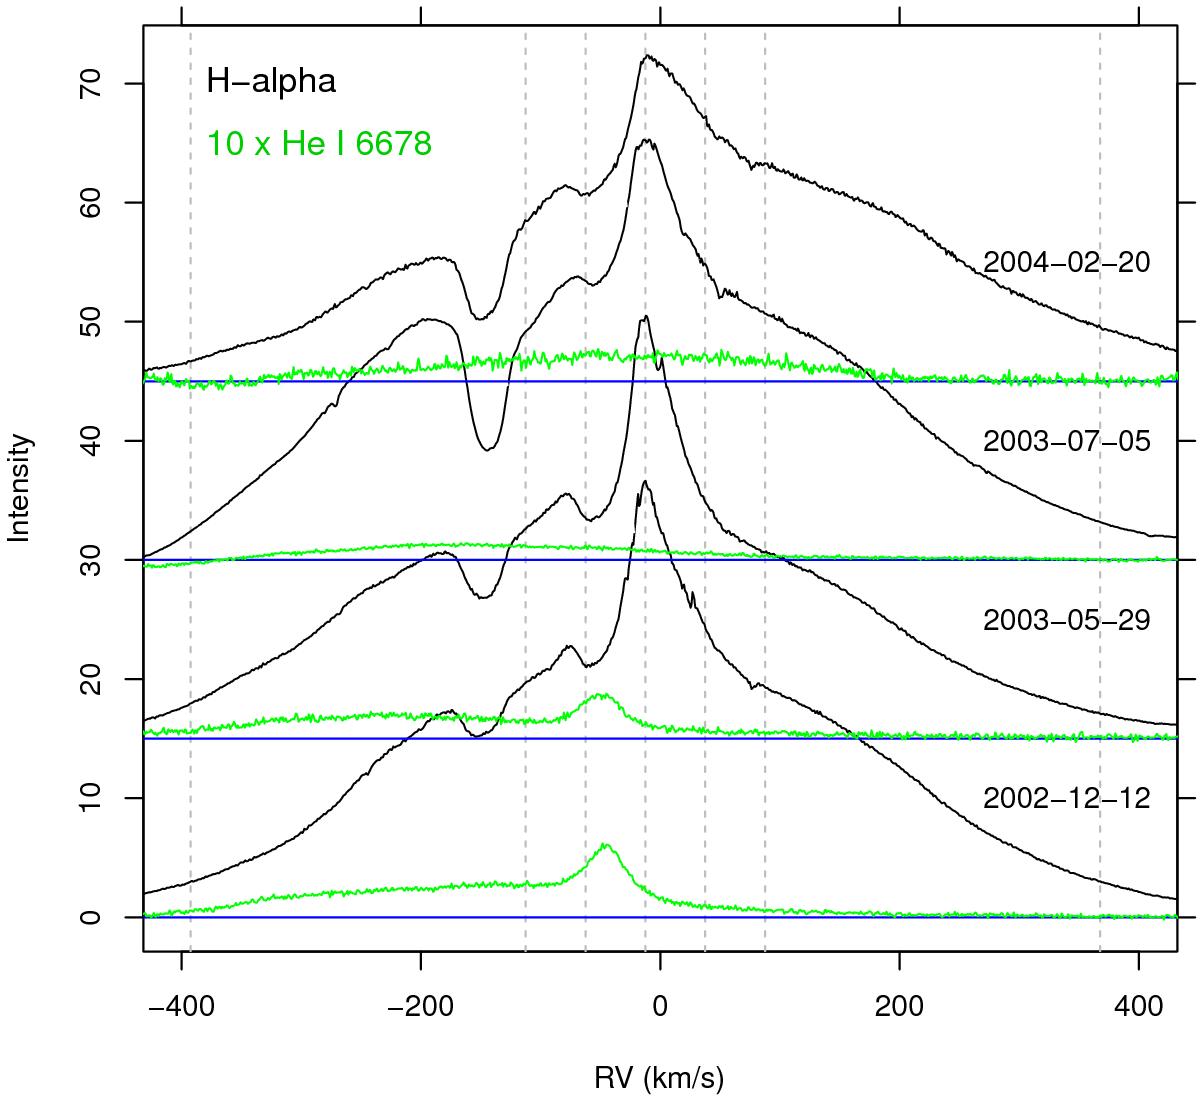
Selection of UVES spectra of η Car in the Hα (black) and He I 6678 lines (green) for the years 2002−2004, as indicated above each spectrum. Spectra are continuum-subtracted and shifted vertically for clarity. The He I line amplitude was enlarged 10 times to facilitate comparison with Hα. Vertical dashed gray lines indicate the same velocities as in Fig. 17.
Current usage metrics show cumulative count of Article Views (full-text article views including HTML views, PDF and ePub downloads, according to the available data) and Abstracts Views on Vision4Press platform.
Data correspond to usage on the plateform after 2015. The current usage metrics is available 48-96 hours after online publication and is updated daily on week days.
Initial download of the metrics may take a while.