Fig. 17
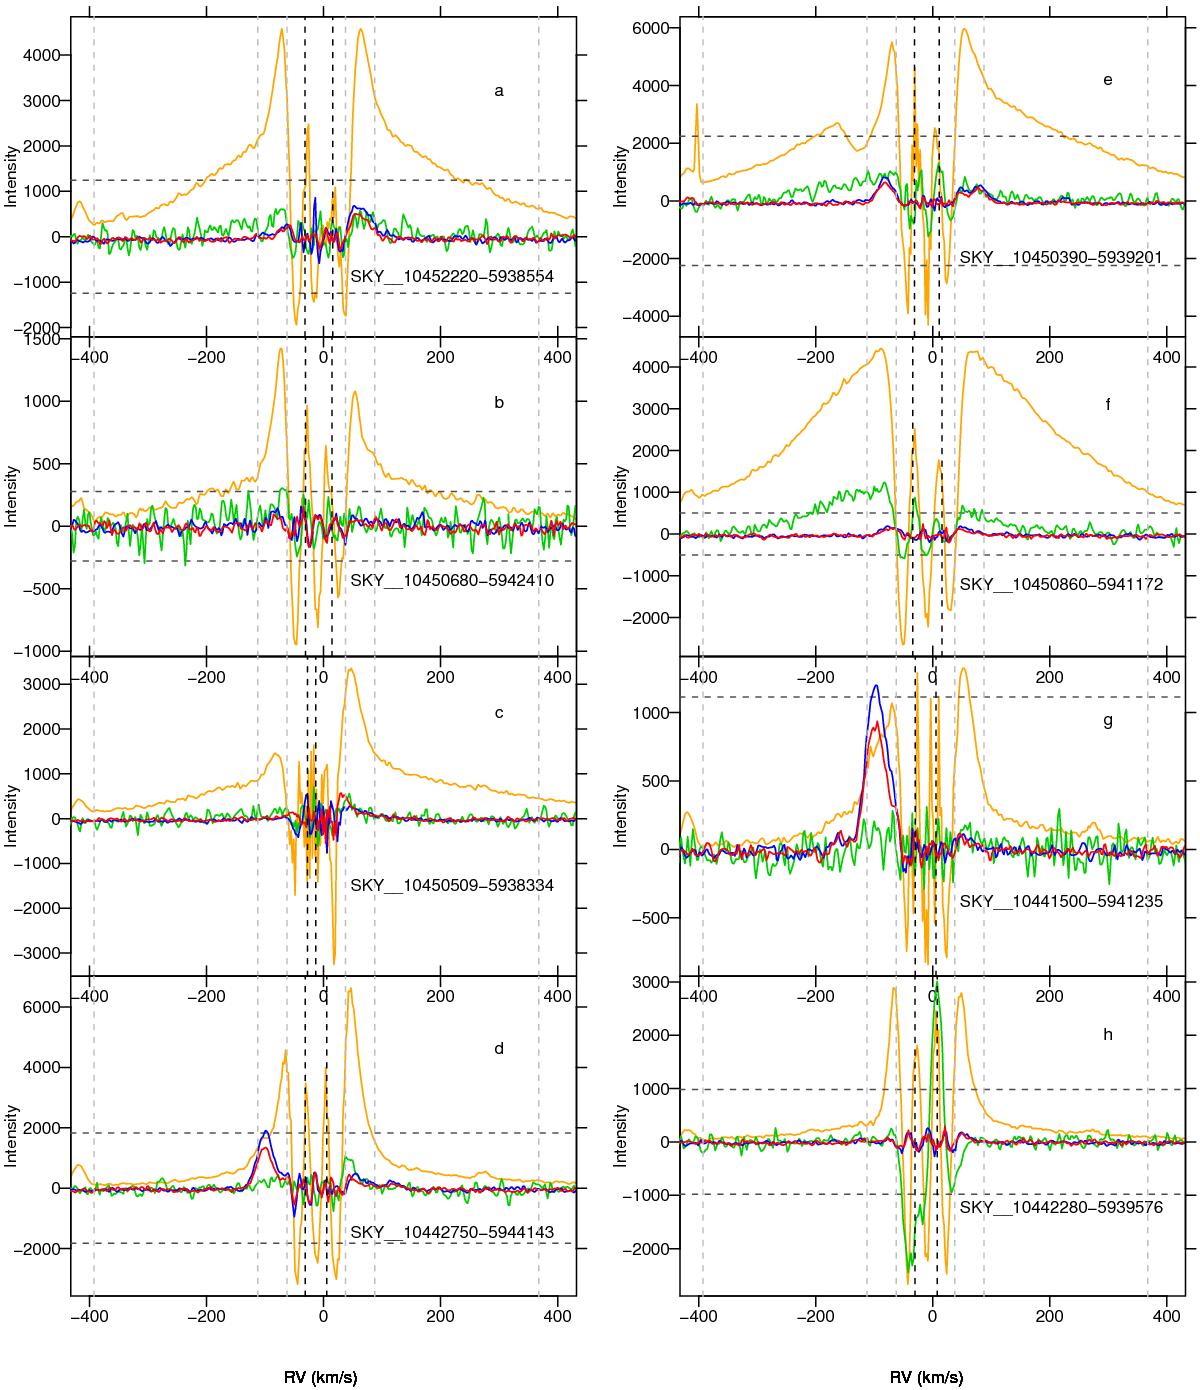
Examples of low-intensity components in the lines, as residuals from the Gaussian best fits to the main components of Hα (orange), He I 6678 (green), [S II] 6717 Å (blue) and 6731 Å (red). The He I residuals are scaled up by a factor of 10, and those of [S II] by a factor of 3. Black vertical dashed lines indicate the RVs of the two main Gaussian components. Gray dashed lines indicate the adopted boundaries to define the wide and narrow Hα wings, all centered at RV =−12.5 km s-1. Indicated radial velocities are heliocentric. The emission features in the Hα profiles at RV ~−420 and ~ + 280 km s-1 originate from terrestrial airglow. In the plotted units, Hα peak emission before best-fit subtraction is for each panel respectively equal to 124 300 (panel a)), 27 800 b), 426 700 c), 182 600 d), 224 200 e), 50 200 f), 111 300 g), and 98 300 h). Intensity levels of ± 1% of peak emission are indicated in each panel by horizontal dashed lines.
Current usage metrics show cumulative count of Article Views (full-text article views including HTML views, PDF and ePub downloads, according to the available data) and Abstracts Views on Vision4Press platform.
Data correspond to usage on the plateform after 2015. The current usage metrics is available 48-96 hours after online publication and is updated daily on week days.
Initial download of the metrics may take a while.