Fig. 15
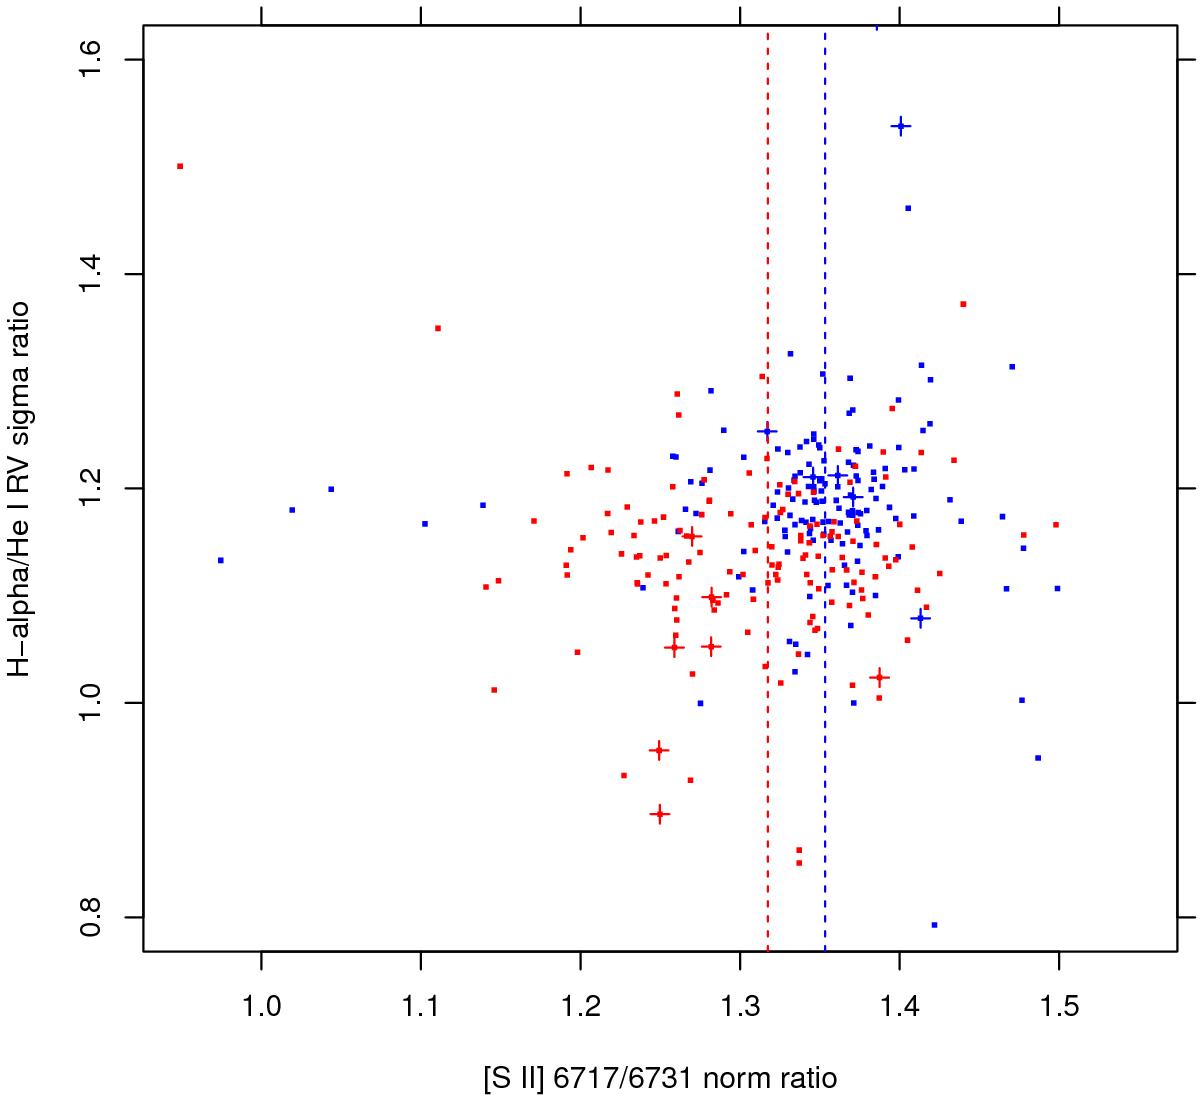
Gaussian width ratio between Hα and He I (proxy for temperature) vs. normalization ratio between [S II] 6717/6731 Å (proxy for density). Temperature increases upwards, while density increases towards the left. Symbols are as in Fig. 7. The red (blue) vertical dashed line indicates the median [S II] 6717/6731 Å ratio for the receding (approaching) components. On average, the receding component has higher density and lower temperature than the approaching component.
Current usage metrics show cumulative count of Article Views (full-text article views including HTML views, PDF and ePub downloads, according to the available data) and Abstracts Views on Vision4Press platform.
Data correspond to usage on the plateform after 2015. The current usage metrics is available 48-96 hours after online publication and is updated daily on week days.
Initial download of the metrics may take a while.