Free Access
Fig. 12
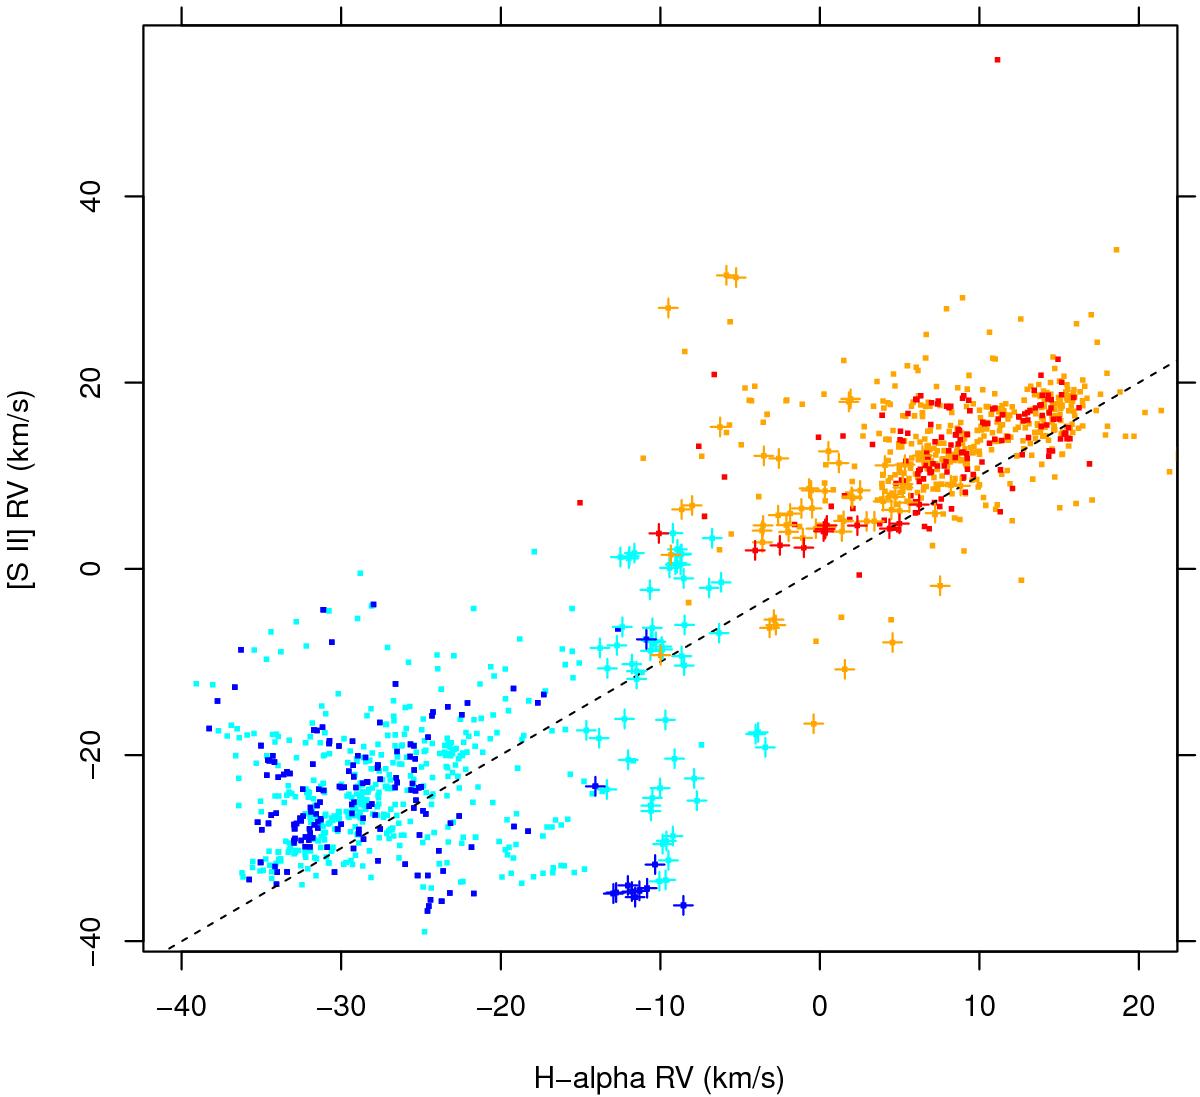
Radial velocity from the [S II] 6717 Å line vs. RV from Hα. Red (blue) symbols refer to the receding (approaching) component from HR15N data. Cyan (orange) symbols refer to the same two components, but from HR15N observations of faint stars. Other symbols as in Fig. 7.
Current usage metrics show cumulative count of Article Views (full-text article views including HTML views, PDF and ePub downloads, according to the available data) and Abstracts Views on Vision4Press platform.
Data correspond to usage on the plateform after 2015. The current usage metrics is available 48-96 hours after online publication and is updated daily on week days.
Initial download of the metrics may take a while.