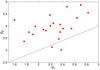
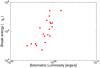
Fig. 9
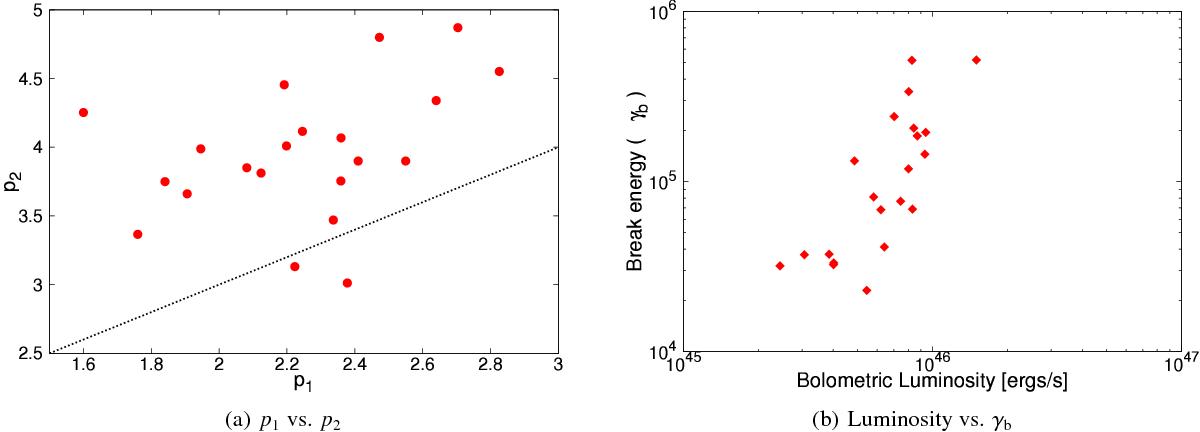
Cross plot of the fit parameters for the one-zone SSC. The black dotted line in the first panel corresponds to the relation p2 = p1 + 1, which is what would have been expected from a synchrotron cooling break. The second panel shows the variation of the synchrotron peak frequency with the total bolometric luminosity. A strong correlation is clearly observed.
Current usage metrics show cumulative count of Article Views (full-text article views including HTML views, PDF and ePub downloads, according to the available data) and Abstracts Views on Vision4Press platform.
Data correspond to usage on the plateform after 2015. The current usage metrics is available 48-96 hours after online publication and is updated daily on week days.
Initial download of the metrics may take a while.