Fig. 2
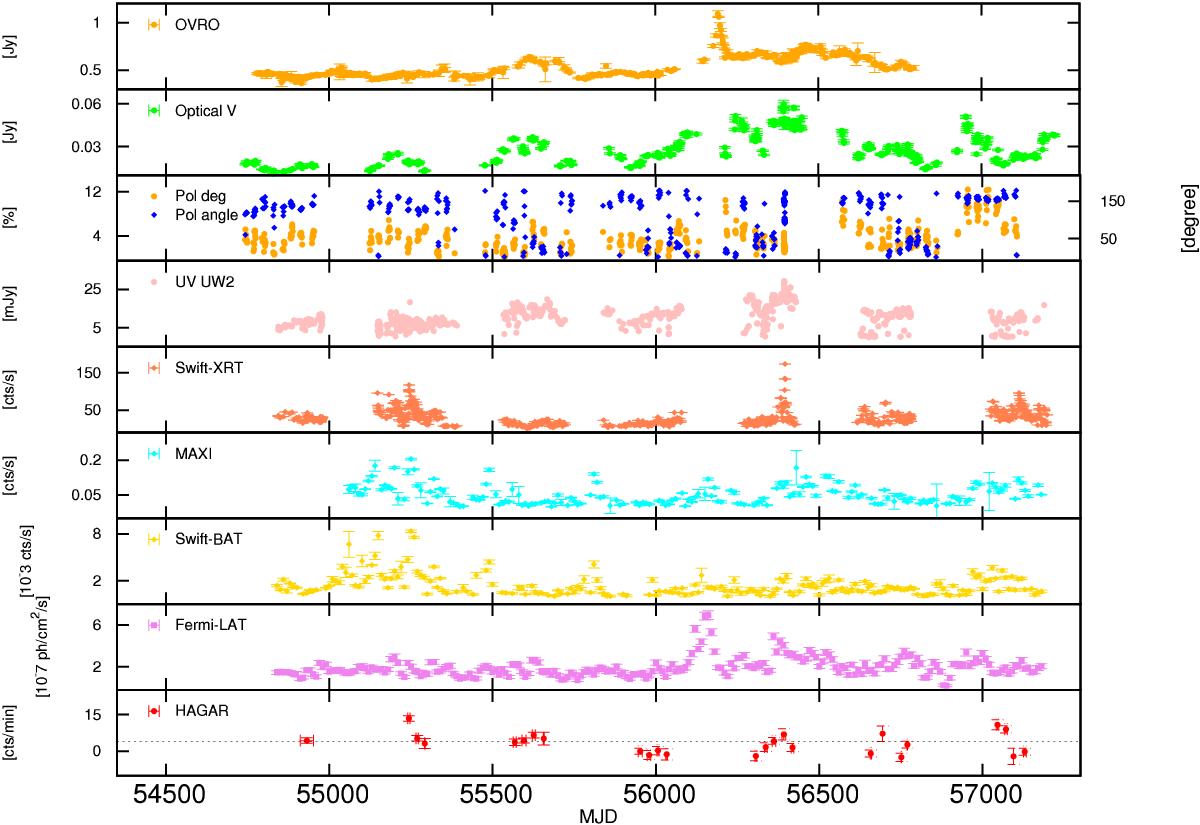
Multiwavelength light curve of Mkn 421 from 2009−2015 showing in panel 1): radio fluxes at 15 GHz from the OVRO; panel 2): optical V-band flux from the CCD-SPOL; panel 3): degree and angle of the optical polarization using data from CCD-SPOL; and panel 4): UV flux in the Swift-UVOT UW2 band. Fluxes in the UW1 and WM2 bands follow a similar trend, and thus only one band has been plotted to avoid cluttering. Panel 5): Swift-XRT count rates; panel 6): MAXI count rate (averaged over 10 days); panel 7): Swift-BAT count rates (10 days averaged); panel 8): Fermi-LAT flux in 10-7 ph/cm2/ s averaged over ten days; and panel 9): HAGAR counts/min, averaged over each observation season. The black dotted line denotes the Crab count rate.
Current usage metrics show cumulative count of Article Views (full-text article views including HTML views, PDF and ePub downloads, according to the available data) and Abstracts Views on Vision4Press platform.
Data correspond to usage on the plateform after 2015. The current usage metrics is available 48-96 hours after online publication and is updated daily on week days.
Initial download of the metrics may take a while.