Fig. 3
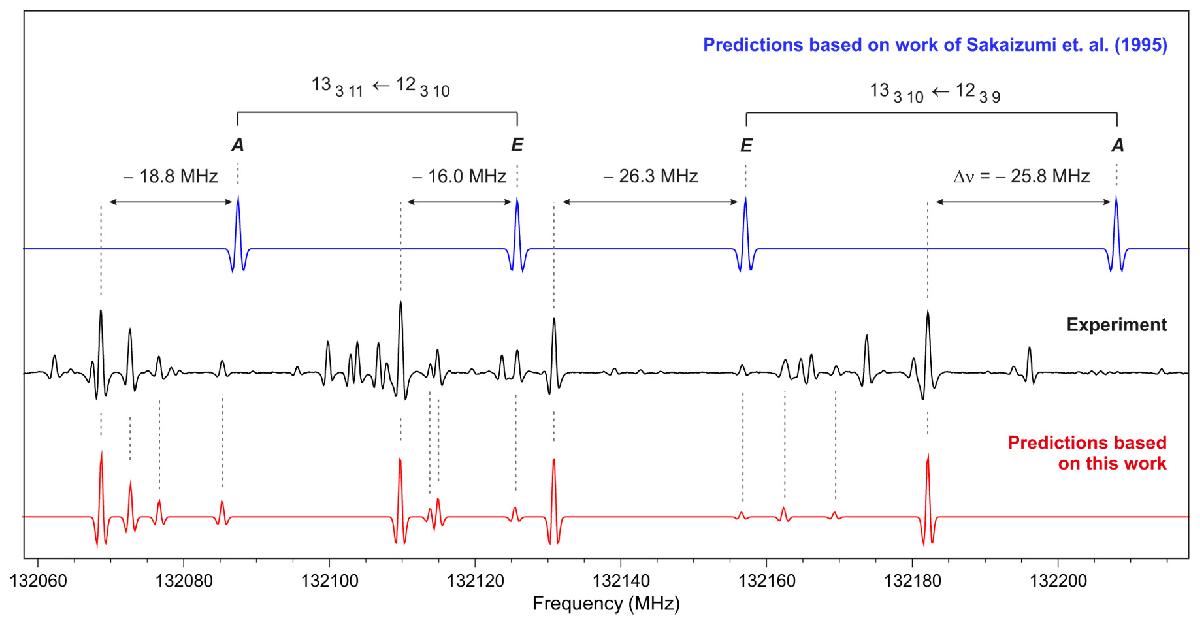
Comparison of the predicted positions of the ground torsional state a-type R-branch transitions of methyl cyanate with the experimentally observed spectrum. The blue model shows predictions based on the previous work of Sakaizumi et al. (1995) and Δν quantity provides the difference between the observed and predicted frequencies. Predictions based on the results of this work are represented by the red model.
Current usage metrics show cumulative count of Article Views (full-text article views including HTML views, PDF and ePub downloads, according to the available data) and Abstracts Views on Vision4Press platform.
Data correspond to usage on the plateform after 2015. The current usage metrics is available 48-96 hours after online publication and is updated daily on week days.
Initial download of the metrics may take a while.