| Issue |
A&A
Volume 591, July 2016
|
|
|---|---|---|
| Article Number | A87 | |
| Number of page(s) | 12 | |
| Section | Stellar structure and evolution | |
| DOI | https://doi.org/10.1051/0004-6361/201628110 | |
| Published online | 20 June 2016 | |
Multiwavelength study of the fast rotating supergiant high-mass X-ray binary IGR J16465−4507⋆
1 AIM (UMR 7158 CEA/DSM-CNRS-Université Paris Diderot), Irfu/Service d’Astrophysique, Centre de Saclay, 91191 Gif-sur-Yvette Cedex, France
e-mail: This email address is being protected from spambots. You need JavaScript enabled to view it.
2 Institut Universitaire de France, 103 boulevard Saint-Michel, 75005 Paris, France
3 Departamento de Física, Ingeniería de Sistemas y Teoría de la Señal, Escuela Politécnica Superior, Universidad de Alicante, Carretera San Vicente del Raspeig s/n, 03690 San Vicente del Raspeig, Spain
4 Santa Cruz Institute for Particle Physics, University of California Santa Cruz, 1156 High St., Santa Cruz, CA 95064, USA
5 APC (UMR 7164 CEA/DSM-CNRS-Université Paris Diderot), 10 rue Alice Domon et Léonie Duquet, 75013 Paris, France
6 Argelander Institut für Astronomie, Auf dem Hügel 71, 53121 Bonn, Germany
7 Instituto de Astrofísica de Canarias, vía Láctea s/n, 38205 La Laguna, Santa Cruz de Tenerife, Spain
8 Departamento de Astrofísica, Facultad de Física y Matemáticas, Universidad de La Laguna, Avda. Astrofísico Francisco Sánchez, s/n, 38206 La Laguna, Santa Cruz de Tenerife, Spain
Received: 11 January 2016
Accepted: 4 April 2016
Abstract
Context. Since its launch, the X-ray and γ-ray observatory INTEGRAL satellite has revealed a new class of high-mass X-ray binaries (HMXB) displaying fast flares and hosting supergiant companion stars. Optical and infrared (OIR) observations in a multi-wavelength context are essential to understand the nature and evolution of these newly discovered celestial objects.
Aims. The goal of this multiwavelength study (from ultraviolet to infrared) is to characterise the properties of IGR J16465−4507, to confirm its HMXB nature and that it hosts a supergiant star.
Methods. We analysed all OIR, photometric and spectroscopic observations taken on this source, carried out at ESO facilities.
Results. Using spectroscopic data, we constrained the spectral type of the companion star between B0.5 and B1 Ib, settling the debate on the true nature of this source. We measured a high rotation velocity of v = 320 ± 8km s-1 from fitting absorption and emission lines in a stellar spectral model. We then built a spectral energy distribution from photometric observations to evaluate the origin of the different components radiating at each energy range.
Conclusions. We finally show that, having accurately determined the spectral type of the early-B supergiant in IGR J16465−4507, we firmly support its classification as an intermediate supergiant fast X-ray transient (SFXT).
Key words: stars: abundances / stars: rotation / supergiants / infrared: stars / X-rays: individuals: IGR J16465-4507 / X-rays: binaries
Based on observations made with ESO Telescopes at the La Silla Paranal Observatory under programme ID 077.D-0038, 077.D-0055, 077.D-0298, 077.D-0568 and 089.D-0056.
© ESO, 2016
1. Introduction
High-mass X-ray binaries (HMXB) consist of a compact object orbiting a massive companion star (M ≥ 10 M⊙, see e.g. reviews of Charles & Coe 2006; Chaty 2013). Depending on the nature of the primary star and the accretion mechanism, they can be divided into two sub-classes: HMXB hosting either a main sequence Be star (BeHMXB) or a supergiant OB star (sgHMXB). The former is characterised by a compact object revolving around a Be V star in a generally wide and eccentric orbit (e ~ 0.3−0.9), where accretion usually happens in the form of outbursts close to periastron passage of the compact object. The latter consists of an OB I star possessing a radially outflowing wind from which the compact object on a low-to-moderate eccentricity orbit is continuously accreting.
OIR observation log.
One of the most important contributions of the INTErnational Gamma-Ray Astrophysics Laboratory satellite (INTEGRAL, Winkler et al. 2003) is the discovery of a new population of sgHMXB, which can be divided into two subclasses (further details and references in Chaty 2013): intrinsically obscured sgHMXB and supergiant fast X-ray transients (SFXT):
-
i.
Multiwavelength studies of the optical and infrared (OIR)counterparts of obscured sgHMXB have revealed the presence oftwo envelopes. The first is a layer of X-ray absorbing materialclose to the compact object; the second is an absorbing envelopeenshrouding the whole binary system.
-
ii
Hard X-ray spectra of SFXT suggest the presence of a compact object such as a neutron star or a black hole. They exhibit rapid outbursts, rising in 10 minutes and lasting typically 3 ks, alternating with long periods of quiescence. Depending on the intensity of the X-ray luminosity and the variability factor (
 ), SFXT can be further separated into two subgroups: “classical” SFXT (low ⟨ LX ⟩, high variability factor), and “intermediate” SFXT (high ⟨ LX ⟩, low variability factor).
Among this new population of sgHMXB, IGR J16465−4507 was discovered with INTEGRAL during its flare observed on 2004 September 6 (Lutovinov et al. 2004). From X-ray Multi-Mirror Mission (XMM-Newton) follow-up observations, Zurita Heras & Walter (2004) accurately located the X-ray counterpart and proposed a near-infrared (NIR) counterpart in the 2MASS catalogue. Smith (2004) identified a bright optical counterpart in the USNO catalogue, and proposed an early spectral type for the companion star. This was confirmed by Negueruela et al. (2005), who estimated the spectral type to B0.5 I, and later by Negueruela et al. (2006), who constrained it to a luminous star in the B0-1 range1, supported by Rahoui et al. (2008) from SED fitting results2. However, the spectral type of the companion star was a matter of debate since Nespoli et al. (2008) later proposed an O9.5 Ia classification3.
Photometric observations with their cumulated exposure time.
Optical photometry of IGR J16465−4507.
NIR photometry of IGR J16465−4507.
Lutovinov et al. (2005) detected a pulsation (spin) period of 228 ± 6 s, and evaluated a strong intrinsic absorption from X-ray fitting. Both the pulsation period and high column density were confirmed by Walter et al. (2006), who qualified this source as a “highly absorbed supergiant transient system”. In their precursor paper, Negueruela et al. (2006) gave the name “SFXT” for the members of this new class of HMXB, and suggested that IGR J16465−4507 was one of them. Later, Walter & Zurita Heras (2007) proposed that it belonged to the newly identified “intermediate SFXT” class. However, the SFXT classification was also debated since La Parola et al. (2010) and Clark et al. (2010) found an orbital period of ~ 30 days from Swift-BAT and INTEGRAL-IBIS observations, whereas typical periods of classical SFXT were of a few days (see e.g. Chaty 2013). This led La Parola et al. (2010) to exclude IGR J16465−4507 from the SFXT class, while Clark et al. (2010) supported the intermediate SFXT classification.
This uncertainty regarding the spectral type and HMXB nature of these systems is critical because their formation and evolution both depend heavily on the nature of the companion star. This work aims to solve these issues by analysing detailed multiwavelength OIR observations both in photometry and spectroscopy. This study is based on all existing observations on this source, retrieved from the ESO archive (see Table 1). The paper is organised as follows. We describe in Sect. 2 the multiwavelength observations and the data reduction process, before presenting the main results and a discussion in Sect. 3. A summary of our conclusions is presented in Sect. 4.
2. Observations
2.1. Photometry
Images were obtained at the European Southern Observatory (ESO) at the focus of the New Technology Telescope (NTT-3.5 m, La Silla, Chile), with three instruments: Extraordinaire Multi-Mode Instrument (EMMI, Dekker et al. 1986) and Superb Seeing Imager (SUSI2, D’Odorico et al. 1998) in optical, and Son OF Isaac (SOFI, Moorwood et al. 1998) in NIR (dates listed in Table 2). Images were acquired in large field mode covering on the sky  (EMMI),
  (SUSI2), and
  (SOFI).
Data reduction was standard, using the Image Reduction and Analysis Facility (IRAF) suite (Tody 1986, 1993). Bias and flat corrections were applied in both wavelength domains. NIR images were taken at nine positions, enabling us to evaluate and remove the sky brightness. Images of the standard stars PG 1633+099(ABCD) in the optical and SJ 9105, 9160, 9170, 9172, 9185, and 9187 in the NIR enabled us to perform photometry using the IRAF.daophot package. We calculated the apparent magnitudes by subtracting the zero-point and extinction coefficient multiplied by the airmass at the time of the observations from the instrumental magnitudes, using the standard formula. Extinction coefficients were taken from the calibration plan of La Silla Observatory.
We present in Tables 3 and 4 the results of our photometry, which represent the first whole set of OIR magnitudes published on this source4.
2.2. Spectroscopy
2.2.1. Optical (FORS1+EMMI) and NIR (SOFI) observations
Optical long slit spectroscopy was performed in service mode on 2006 April 24 at the Very Large Telescope (VLT, Paranal, Chile) Unit Telescope Kueyen (UT2), equipped with the spectro-imager FOcal Reducer and low dispersion Spectrograph (FORS1), fitted with a thinned Tektronix 24 μm 2048 × 2048 pixel CCD, with an exposure time of 1670 s. We used the holographic grism 1200B+97, providing a nominal dispersion of 0.06 nm/pixel over the 372−486 nm range, and a slit  in width, which led to a spectral resolution of
  . A calibration spectrum was obtained with the same setup. Additional optical spectra (6 × 300 s) were acquired with EMMI on ESO/NTT in Red Imaging and Low Dispersion Spectrum (RILD) mode, in the red arm through an 1″ slit on 2006 August 7 (spectral resolution R = 613).
NIR long slit spectroscopy was also obtained at ESO/NTT using SOFI low resolution grisms, between 2006 July 14 and September 3: 36 spectra × 60 s exposure time taken with Grism Blue Filter (GBF, Δλ = 0.95−1.64 μm, R ~ 930, dispersion = 0.696 nm/pixel), and 36 spectra × 60 s exposure time taken with Grism Red Filter (GRF, Δλ = 1.53−2.52 μm, R ~ 980, dispersion = 1.022 nm/pixel), both through a  slit.
slit.
The FORS1 spectrum was reduced with the Starlink packages ccdpack (Draper et al. 2000) and Figaro (Shortridge et al. 1997). EMMI and SOFI spectra were reduced using IRAF in a standard way. We first performed bias and flat correction, and removed cosmic rays using IRAF.lacos task. We then applied wavelength calibration before subtracting the telluric sky lines, and performed spectra extraction with IRAF.noao.twodspec package. Finally, we combined all the spectra for each instrument together to increase the signal-to-noise ratio. FORS1, EMMI, and SOFI spectra are shown in Figs. 1–5; the positions of identified spectral features are indicated by dashed lines. Many hydrogen and helium lines are seen in absorption and some of them present a shape typical of self-absorbed lines. Bright metal lines are also identified in some spectra.
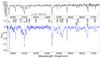 |
Fig. 1 FORS1 spectrum of IGR J16465−4507 from 395 to 475 nm (flux axis is in arbitrary units). For comparison, a spectrum of the B0.5 I star k Ori is shown in the upper panel (Walborn & Fitzpatrick 1990). |
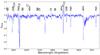 |
Fig. 2 EMMI spectrum of IGR J16465−4507 from 570 to 710 nm (flux axis is in arbitrary units). |
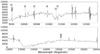 |
Fig. 3 SOFI/GBF spectrum of IGR J16465−4507 from 950 to 1650 nm (flux axis is in arbitrary units). Features at ~1190, 1210, and 1265 nm are due to strong atmosphere absorption in the J band. |
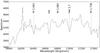 |
Fig. 4 SOFI/GRF (H part) spectrum of IGR J16465−4507 from 1600 to 1750 nm (flux axis is in arbitrary units). The feature at ~ 1625 nm is probably due to a bad background correction at the edge of the grism. |
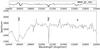 |
Fig. 5 SOFI/GRF (Ks part) spectrum of IGR J16465−4507 from 2040 to 2200 nm. A typical B0.5 Ib spectrum is indicated at the top of the figure (flux axis is in arbitrary units for both spectra). |
2.2.2. Ultraviolet to NIR X-Shooter observations
The X-Shooter5 instrument is the successor spectrograph of FORS1, mounted at the UT2 cassegrain focus (Vernet et al. 2011). Thanks to its three arms –UV-blue (UVB), visible (VIS) and near-IR (NIR)–, the main characteristic of this medium-resolution spectrograph is its ability to cover, in a single observation, a wide wavelength range from 300 to 2480 nm. In July 2012 we obtained guaranteed time on X-Shooter to observe a small sample of bright INTEGRAL counterparts in order to better constrain their nature. Preliminary results on three sources, including IGR J16465−4507, have been reported in Goldoni et al. (2012).
All the spectra were taken with narrow slits: slit width  and sampling 3.5 pix/FWHM (full width half maximum) for the UVB arm, slit width
  and sampling 4.8 pix/FWHM for the VIS arm, and slit width and sampling 2.9 pix/FWHM for the NIR arm. As described in Goldoni et al. (2012), we also took four different pointings of 300 s each in the echelle slit-nod mode with an offset of 5′′ along slits between pointings in a standard ABBA sequence. To avoid saturation, the exposures on the VIS and NIR arms were split into shorter integrations. In addition, for calibration purposes each source was briefly observed with a wide (
 ) slit in order to estimate the slit losses. A telluric A0V star was observed before each source, and a flux standard was observed at the beginning of the night.
The spectra were retrieved from the ESO archive, and processed using the X-Shooter pipeline (Modigliani et al. 2010)6. We clearly detected the source in each of the three arms. All X-Shooter spectra are given in nm (Figs. 6–8).
All the identified lines are listed in the Appendix (Tables A.1 to A.8).
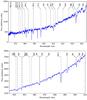 |
Fig. 6 X-Shooter/UVB spectrum of IGR J16465−4507 from 360 to 510 nm. DIB stands for diffuse interstellar band. |
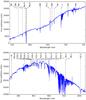 |
Fig. 7 X-Shooter/VIS spectrum of IGR J16465−4507 from 540 to 1020 nm. DIB stands for diffuse interstellar band, and T telluric lines. |
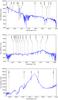 |
Fig. 8 X-Shooter/NIR spectrum of IGR J16465−4507 from 990 to 2300 nm. |
3. Results and discussion
3.1. Spectral type determination
3.1.1. FORS1 and X-Shooter optical observations
We first determined the spectral type in the optical domain, comparing the main lines identified in our FORS1 and X-Shooter/UVB spectra (Figs. 1 and 6 respectively) with the optical stellar spectral atlas from Walborn & Fitzpatrick (1990). We note that the He i and Si iii lines, clearly detected in both spectra, are more intense than the He ii and Si iv lines, which is consistent with an early-B type. Then, the Hγ 434.1 nm line, present in both spectra, appears blended with a prominent O ii line (see Fig. 6), which clearly exhibits a structure typical of spectral types close to B1 Ib.
In addition, by examining the X-Shooter/VIS spectrum reported in Fig. 7, we realised that the Paschen line P16, detected at 850.0 nm, must be blended with the C iii 850.2 nm line because its intensity is higher than that of other Paschen lines at longer wavelengths (i.e. lower members of the same series). This detection of carbon in the spectrum suggests a spectral type earlier than B1 I (see e.g. Negueruela et al. 2010). Furthermore, the presence of only a very weak He ii line at ~ 420 nm (see X-Shooter/UVB spectra)7 shows that the spectral type cannot be earlier than B0 I (see e.g. Walborn & Fitzpatrick 1990).
Finally, we observed that the optical spectrum of IGR J16465−4507 is very similar to the typical B0.5 I spectrum indicated at the top of Fig. 1. Thus from all of the above we can constrain the spectral type to a luminous supergiant star of spectral type between B0.5 I and B1 I. This result is in agreement with the preliminary X-Shooter spectra of this source reported in Goldoni et al. (2012).
3.1.2. SOFI and X-Shooter NIR observations
We then completed our determination of the spectral type of the companion star by comparing our NIR spectra with the atlas of stellar spectral types in NIR reported in Hanson et al. (1996). We identified the main features in the wavelength range from 2.04 μm to 2.2 μm (see SOFI/GRF and X-Shooter/NIR spectra in Figs. 5 and 8). He i2112.5 nm and H i2166.1 nm are seen in absorption, which is typical of late-O and early-B stars. On the other hand, He i2058.9 nm is in emission, which is incompatible with the O9.5 type proposed by Nespoli et al. (2008). Instead, we notice that the NIR spectrum of IGR J16465−4507 is very similar to the typical low-resolution B0.5 Ib spectrum indicated at the top of Fig. 5.
We thus conclude that the companion star of IGR J16465−4507 exhibits a spectral type between B0.5 Ib and B1 Ib, which is in agreement with our determination above of the spectral type based on optical spectra. Finally, this result is consistent with the preliminary identification and with the classification as an SFXT first suggested by Negueruela et al. (2006).
3.2. Rotation and expansion velocity
We determine the stellar rotation velocity using the classical formula of the Doppler-Fizeau effect, applied by measuring the FWHM of several H and He lines, and making the appropriate correction for the differing central wavelengths of each line, following Steele et al. (1999):  (1)Here vr is the radial velocity, i the inclination angle, c the velocity of light, and λ the wavelength.
The results are listed in Table 5. Despite a large dispersion, we calculated from this set of values a median rotation velocity of v = 430km s-1. This value is extremely high, considering typical stellar rotation velocities in sgHMXB between v = 50 and v = 150km s-1 (Liu et al. 2006). While Goldoni et al. (2012) have already reported a rotation velocity greater than v = 200km s-1, the high inclination they invoked cannot be the only reason for this unusually high value.
We report in Sect. 3.3 below that more elaborate modelling using X-Shooter spectra give a velocity v = 320 ± 8km s-1. Our observations thus suggest that the companion star of IGR J16465−4507 is a luminous supergiant star of spectral type B0.5–B1 Ib with very high rotation velocity. Therefore, the star must have a small radius, typically of ~ 15 R⊙, in order not to be disrupted by such a high stellar rotation velocity.
In addition, we clearly detect additional emission in the wings of Hα (H i 656.2 nm) both in EMMI (Fig. 2) and X-Shooter/VIS (Fig. 7) spectra, and we also identify a P-Cygni profile at H i 1093.8 nm in both SOFI/GBF (Fig. 3) and X-Shooter/NIR (Fig. 8) spectra. These features are probably due to circumstellar material (disk-like?) in a similar way to IGR J16318–4848 (Chaty & Rahoui 2012), giving an estimate of the expansion velocity of the envelope: v = 160−180km s-1.
Rotation velocity measurement obtained by fitting spectral line width (the associated error is of the order of 10%).
3.3. Stellar spectrum modelling
We applied the iacob-broad Interactive Data Language (IDL) tool described in Simón-Díaz & Herrero (2014) to estimate the projected rotational velocity of the star and the amount of macroturbulent broadening (ΘRT) affecting the line profiles. Unfortunately, metallic lines are very broad and often blended. The determination was thus carried out with the He i 492.2 nm line (X-Shooter/UVB spectrum in Fig. 6). We derived the value v = vr × sini = 320 ± 8km s-1. This value for the rotational velocity is much higher than that found for objects of similar spectral type with the same method (Simón-Díaz & Herrero 2014). For such high projected rotational velocity, the value of ΘRT is negligible and was thus taken as zero.
A quantitative spectroscopic analysis was subsequently performed by means of Fast Analysis of STellar atmospheres with WINDs (FASTWIND; Santolaya-Rey et al. 1997, Puls et al. 2005), a spherical, non-LTE model atmosphere code with mass loss and line-blanketing that follows the strategy described in Castro et al. (2012). It is based on an automatic χ2 fitting of synthetic FASTWIND spectra including lines from H , He i-ii, Si ii-iv, Mg ii, C ii, N ii-iii, and O ii to the global X-Shooter spectrum between 390 and 510 nm. The results of the fit are shown in Fig. 9, and the stellar parameters and abundances measured from this fit are given in Tables 6 and 7, respectively.
While we find a velocity of v = 320 ± 8 km s-1 from Fourier analysis, the line fitting favours a velocity of v = 280km s-1, obtained with errors of the order of 10%, therefore likely consistent with 320 ± 8km s-1. The stellar parameters – effective temperature  K and gravity
  – are consistent with a star of spectral type B0.5 Ib (McErlean et al. 1999), therefore consistent with the spectral classification described above. The helium abundance seems high, but the value obtained corresponds to the upper edge of the grid. However, we caution that the sensitivity of the He lines to abundance is not very high at this temperature. While Si, Mg, and O have solar abundances, the star seems mildly C- and N-enhanced within the large error bars8, but this is expected for a fast rotator.
Stellar parameters measured from modelling X-Shooter spectra with FASTWIND.
Chemical abundances in  resulting from the FASTWIND spectroscopic analysis.
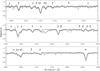 |
Fig. 9 Overplot of the X-Shooter spectrum of IGR J16465−4507 from 400 to 490 nm with the stellar atmosphere model fit. |
3.4. Reddening correction
To correct the magnitude from the reddening due to the absorption of the interstellar medium (ISM), we applied the same method described in Chaty et al. (2011). From the value of the column density N(H) = 8.7 × 1021 cm-2 (Nespoli et al. 2008), we calculated the corresponding colour excess E(B−V) using Bohlin et al. (1978),  (2)We then determined the interstellar absorption in the V-band AV,
  (3)where Rv = 3.1 represents the average extinction parameter in the Milky Way.
Using the coefficients a(x) and b(x) given by Cardelli et al. (1989), we derived Aλ, the interstellar absorption in the other filters:  (4)We finally subtracted these values from the apparent magnitudes for each wavelength:
  (5)Following Munari et al. (2008), another way to calculate AV is to determine E(B−V) from the measurement of the equivalent width of the diffuse interstellar band (DIB) at 862.1 nm (see X-Shooter/VIS spectrum in Fig. 7):
  (6)This DIB has been detected with EW = 0.067 nm leading to a value of E(B−V) = 1.82 ± 0.02. We thereafter apply the same process described above, and find AV = 5.65 ± 0.06.
The value of AV = 4.65 found with the photometric method is ~ 1 mag smaller than the AV estimated by Rahoui et al. (2008), while the value of AV = 5.65 ± 0.06 estimated spectroscopically is well inside their confidence range. In the following, we use this latter value. As already noted by Goldoni et al. (2012), this may suggest a non-standard extinction law in the direction of the source. We show in Fig. 10 both reddened and dereddened magnitudes9.
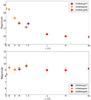 |
Fig. 10 Photometric magnitudes of IGR J16465−4507, respectively before (upper panel) and after (lower panel) dereddenning. |
3.5. Spectral energy distribution
We show in Fig. 11 (upper panel) the spectral energy distribution (SED) in the OIR domain. In addition to our photometric data, we included our SOFI and FORS1 spectra. The optical part represents a substantial contribution, consistent with the supergiant nature of the companion star. This SED presents a NIR excess which is characteristic of an envelope surrounding the supergiant star.
In the lower panel of Fig. 11, we also added the fitted X-ray component in the 1-100 keV energy band extracted from the work of Lutovinov et al. (2005). The X-ray part of the SED represents a contribution of roughly the same order as the optical part, favouring a scenario of stellar wind accretion, less luminous in X-rays than a direct accretion through an accretion disk (see e.g. Tauris & van den Heuvel 2006).
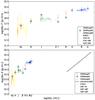 |
Fig. 11 Upper panel: OIR SED showing photometric and spectroscopic measurements. Lower panel: same SED including the 1–100 keV X-ray component. |
3.6. Lightcurve
Short exposure images were acquired with SUSI2 in the V band every 30 s over 30 min, on 2006 August 6 (Table 1). This rapid photometry (Fig. 12) in the optical allows us to study intrinsic luminosity variations on short timescales. While the variations we detect are of the same order as the error on the magnitudes, this result is consistent with micro-variability exhibited by supergiant stars of spectral types earlier than B (see e.g. Bresolin et al. 2004, Laur et al. 2012).
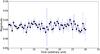 |
Fig. 12 Optical photometric lightcurve of IGR J16465−4507 taken with SUSI2 in the V band. |
3.7. Position in the Corbet diagram
As described in Sect. 1, HMXB can be classified in three groups (sgHMXB or wind-fed systems, BeHMXB, and Roche-lobe filling systems) regarding their position in the orbital period versus spin period plot, the so-called Corbet diagram (Corbet 1986). Contrary to the other two groups, BeHMXB exhibit a correlation between these two periods, which can be explained by transfer of angular momentum through accretion every time the compact object passes at periastron (for more details see Chaty 2013). From Lutovinov et al. (2005) and Clark et al. (2010), who respectively determined the spin (228 ± 6 s) and the orbital period (~ 30 days), we present here an updated plot of this diagram (Fig. 13) including HMXB from Liu et al. (2006) catalogue.
This plot shows the peculiar position of IGR J16465−4507, located right between the BeHMXB and sgHMXB area, even though our spectroscopic observations led us to conclude that its companion star was an early-B supergiant. Two other known SFXT (IGR J11215–5952 and IGR J18483–0311) have been found in the same area of the diagram and studied by Liu et al. (2011), who suggested that some SFXT could be the descendants of BeHMXB. The high rotation velocity of the supergiant star might thus originate from the rapid rotator nature of BeHMXB.
While this rotation velocity is higher than the typical velocity of OB main sequence stars (of the order of ~ 150 km s-1, see e.g. Murphy 2014), it is not unlikely for a Be system. Taking an O7-8 main sequence star, its radius would increase by more than 50% and its rotation velocity accelerate to ~ 350 km s-1, which approaches, but is still inferior to the break-up velocity (close to ~ 400 km s-1, Brott et al. 2011). Another possibility would be that the mass transfer from the primary has occurred in recent times, thus suggesting that we are facing a very young object.
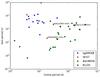 |
Fig. 13 Blue circles and green squares in this updated Corbet diagram represent wind-fed systems (sgHMXB) and BeHMXB, respectively. Red diamonds indicate SFXT; three are misplaced in this diagram: IGR J11215–5952, IGR J18483–0311, and IGR J16465−4507. RLOS stands for Roche-lobe overflow systems. |
4. Conclusions
We analysed all photometric and spectroscopic observations of IGR J16465−4507 performed between 2006 and 2012, and taken from the ESO archive. From spectroscopic data, we constrain the companion star to be an early-B spectral type between B0.5 and B1 Ib, in agreement with the preliminary determination by Negueruela et al. (2005).
The peculiar feature of this star, determined from spectroscopic observations and stellar fit modelling, is its high rotation velocity of v = 320 ± 8km s-1, suggesting a small radius of the supergiant star to avoid any disruption. We reported a SED in the OIR domain, showing a substantial contribution of the OIR emission from the companion star and an IR excess probably coming from a circumstellar envelope. We conclude that this system must be composed of a blue supergiant surrounded by a colder envelope, consistent with its SFXT classification as initially proposed by Negueruela et al. (2006). The group of sgHMXB of our Galaxy now includes 38 members, and IGR J16465−4507 is the ninth member discovered by INTEGRAL with a confirmed spectral type (Coleiro et al. 2013).
Furthermore, the position of this source on the Corbet diagram shows that it is probably a third member of SFXT located between Be and supergiant systems, and therefore possibly a descendant of BeHMXB. Finally, this system allows us to open new perspectives of research to study the evolution of HMXB in general, and the links between different populations of HMXB in particular.
From optical observations with EMMI at ESO/NTT.
From mid-infrared observations with VISIR at ESO/VLT.
From NIR observations with SOFI at ESO/NTT.
Apart from the USNO and 2MASS catalogues.
X-Shooter is the first second-generation instrument installed in 2008 at the ESO VLT.
These so-called Phase 3 data are reduced using slit-nod related recipes, including flat and bias correction, and wave and flux calibration.
We identify the line close to ~420 nm as He ii instead of N ii, based on the absence of other nitrogen lines in our spectrum (see e.g. the spectrum of BD + 36°4063 in Walborn & Howarth 2000).
The large errors in the abundances are due to the signal-to-noise ratio, v, and the weakness of some key lines, which may blur the lines with the normalised continuum. Moreover, carbon and magnesium abundances are based only on one line each.
As none of the coefficients was available for the Z filter, the magnitude in this band is not dereddened.
Acknowledgments
We thank the anonymous referee for a constructive report. This work was supported by the Centre National d’Études Spatiales (CNES). It is based on observations obtained with MINE: the Multi-wavelength INTEGRAL NEtwork. This research is partially supported by the Spanish Mineco under grants AYA2012-39364-C02-01/02. The work of IND is also supported by the Spanish Ministerio de Educación y Ciencia under grant PRX14-00169. IRAF is distributed by the National Optical Astronomy Observatory, which is operated by the Association of Universities for Research in Astronomy (AURA) under a cooperative agreement with the National Science Foundation. This publication makes use of data products from the Two Micron All Sky Survey, which is a joint project of the University of Massachusetts and the Infrared Processing and Analysis Center/California Institute of Technology, funded by the National Aeronautics and Space Administration and the National Science Foundation. This research has made use of the USNO Image and Catalogue Archive operated by the United States Naval Observatory, Flagstaff Station (http://www.nofs.navy.mil/data/fchpix/).
References
- Bohlin, R. C., Savage, B. D., & Drake, J. F. 1978, ApJ, 224, 132 [NASA ADS] [CrossRef] [Google Scholar]
- Bresolin, F., Pietrzyński, G., Gieren, W., et al. 2004, ApJ, 600, 182 [NASA ADS] [CrossRef] [Google Scholar]
- Brott, I., de Mink, S. E., Cantiello, M., et al. 2011, A&A, 530, A115 [NASA ADS] [CrossRef] [EDP Sciences] [Google Scholar]
- Cardelli, J., Clayton, G., & Mathis, J. 1989, ApJ, 345, 245 [NASA ADS] [CrossRef] [Google Scholar]
- Castro, N., Urbaneja, M. A., Herrero, A., et al. 2012, A&A, 542, A79 [NASA ADS] [CrossRef] [EDP Sciences] [Google Scholar]
- Charles, P. A. & Coe, M. J. 2006, Compact stellar X-ray sources., eds. W. H. G., Lewin, & M., van der Klis (Cambridge, UK: Cambridge University Press), Cambridge Astrophys. Ser., 39, 215 [Google Scholar]
- Chaty, S. 2013, Adv. Space Res., 52, 2132 [Google Scholar]
- Chaty, S., & Rahoui, F. 2012, ApJ, 751, 150 [NASA ADS] [CrossRef] [Google Scholar]
- Chaty, S., Dubus, G., & Raichoor, A. 2011, A&A, 529, A3 [NASA ADS] [CrossRef] [EDP Sciences] [Google Scholar]
- Clark, D. J., Sguera, V., Bird, A. J., et al. 2010, MNRAS, 406, L75 [NASA ADS] [Google Scholar]
- Coleiro, A., Chaty, S., Zurita Heras, J. A., Rahoui, F., & Tomsick, J. A. 2013, A&A, 560, A108 [NASA ADS] [CrossRef] [EDP Sciences] [Google Scholar]
- Corbet, R. H. D. 1986, MNRAS, 220, 1047 [NASA ADS] [CrossRef] [Google Scholar]
- Dekker, H., Delabre, B., & Dodorico, S. 1986, in Instrumentation in astronomy VI, ed. D. L. Crawford, Proc. SPIE, 627, 339 [NASA ADS] [CrossRef] [Google Scholar]
- D’Odorico, S., Beletic, J. W., Amico, P., et al. 1998, in Optical Astronomical Instrumentation, ed. S. D’Odorico, Proc. SPIE, 3355, 507 [NASA ADS] [CrossRef] [Google Scholar]
- Draper, P., Taylor, M., & Allan, A. 2000, Starlink User Note 139.12, R.A.L. [Google Scholar]
- Goldoni, P., Chaty, S., Goldwurm, A., & Coleiro, A. 2012, in Proc. An INTEGRAL view of the high-energy sky (the first 10 years) - 9th INTEGRAL Workshop and celebration of the 10th anniversary of the launch (INTEGRAL 2012), 15–19 October 2012, France, http://pos.sissa.it/cgi-bin/reader/conf.cgi?confid=176, id.96 [Google Scholar]
- Hanson, M. M., Conti, P. S., & Rieke, M. J. 1996, ApJS, 107, 281 [Google Scholar]
- La Parola, V., Cusumano, G., Romano, P., et al. 2010, MNRAS, 405, L66 [NASA ADS] [CrossRef] [Google Scholar]
- Laur, J., Tuvikene, T., Eenmäe, T., Kolka, I., & Leedjärv, L. 2012, Balt. Astron., 21, 531 [NASA ADS] [Google Scholar]
- Liu, Q. Z., van Paradijs, J., & van den Heuvel, E. P. J. 2006, A&A, 455, 1165 [NASA ADS] [CrossRef] [EDP Sciences] [Google Scholar]
- Liu, Q. Z., Chaty, S., & Yan, J. Z. 2011, MNRAS, 415, 3349 [NASA ADS] [CrossRef] [Google Scholar]
- Lutovinov, A., Rodrigues, J., Budtz-Jorgensen, C., Grebenev, S., & Winkler, C. 2004, ATel, 329, 1 [Google Scholar]
- Lutovinov, A., Revnivtsev, M., Gilfanov, M., et al. 2005, A&A, 444, 821 [NASA ADS] [CrossRef] [EDP Sciences] [Google Scholar]
- McErlean, N. D., Lennon, D. J., & Dufton, P. L. 1999, A&A, 349, 553 [NASA ADS] [Google Scholar]
- Modigliani, A., Goldoni, P., Royer, F., et al. 2010, in SPIE Conf. Ser., 7737, 28 [Google Scholar]
- Moorwood, A., Cuby, J.-G., & Lidman, C. 1998, The Messenger, 91, 9 [NASA ADS] [Google Scholar]
- Munari, U., Tomasella, L., Fiorucci, M., et al. 2008, A&A, 488, 969 [NASA ADS] [CrossRef] [EDP Sciences] [Google Scholar]
- Murphy, S. J. 2014, Ph.D. Thesis, Jeremiah Horrocks Institute, University of Central Lancashire, Preston, UK [Google Scholar]
- Negueruela, I., Smith, D. M., & Chaty, S. 2005, ATel, 429, 1 [Google Scholar]
- Negueruela, I., Smith, D. M., Reig, P., Chaty, S., & Torrejón, J. M. 2006, ed. A. Wilson, ESA SP, 604, 165 [NASA ADS] [Google Scholar]
- Negueruela, I., Clark, J. S., & Ritchie, B. W. 2010, A&A, 516, A78 [NASA ADS] [CrossRef] [EDP Sciences] [Google Scholar]
- Nespoli, E., Fabregat, J., & Mennickent, R. E. 2008, A&A, 486, 911 [NASA ADS] [CrossRef] [EDP Sciences] [Google Scholar]
- Puls, J., Urbaneja, M. A., Venero, R., et al. 2005, A&A, 435, 669 [NASA ADS] [CrossRef] [EDP Sciences] [Google Scholar]
- Rahoui, F., Chaty, S., Lagage, P.-O., & Pantin, E. 2008, A&A, 484, 801 [NASA ADS] [CrossRef] [EDP Sciences] [Google Scholar]
- Santolaya-Rey, A. E., Puls, J., & Herrero, A. 1997, A&A, 323, 488 [NASA ADS] [Google Scholar]
- Shortridge, K., Meyerdicks, H., & Currie, M. 1997, Starlink User Note 86.15, R.A.L. [Google Scholar]
- Simón-Díaz, S., & Herrero, A. 2014, A&A, 562, A135 [NASA ADS] [CrossRef] [EDP Sciences] [Google Scholar]
- Smith, D. M. 2004, ATel, 338, 1 [Google Scholar]
- Steele, I. A., Negueruela, I., & Clark, J. S. 1999, A&AS, 137, 147 [NASA ADS] [CrossRef] [EDP Sciences] [Google Scholar]
- Tauris, T. M. & van den Heuvel, E. P. J. 2006, Compact stellar X-ray sources, eds. W. H. G. Lewin, & M. van der Klis (Cambridge, UK: Cambridge University Press), Cambridge Astrophys. Ser., 39, 623 [Google Scholar]
- Tody, D. 1986, in Instrumentation in astronomy VI, ed. D. L. Crawford, Proc. SPIE, 627, 733 [Google Scholar]
- Tody, D. 1993, in Astronomical Data Analysis Software and Systems II, eds. R. J. Hanisch, R. J. V. Brissenden, & J. Barnes, ASP Conf. Ser., 52, 173 [Google Scholar]
- Vernet, J., Dekker, H., D’Odorico, S., et al. 2011, A&A, 536, A105 [NASA ADS] [CrossRef] [EDP Sciences] [Google Scholar]
- Walborn, N. R., & Fitzpatrick, E. L. 1990, PASP, 102, 379 [NASA ADS] [CrossRef] [Google Scholar]
- Walborn, N. R., & Howarth, I. D. 2000, PASP, 112, 1446 [NASA ADS] [CrossRef] [Google Scholar]
- Walter, R., & Zurita Heras, J. 2007, A&A, 476, 335 [Google Scholar]
- Walter, R., Zurita Heras, J., Bassani, L., et al. 2006, A&A, 453, 133 [NASA ADS] [CrossRef] [EDP Sciences] [Google Scholar]
- Winkler, C., Courvoisier, T. J.-L., Di Cocco, G., et al. 2003, A&A, 411, L1 [NASA ADS] [CrossRef] [EDP Sciences] [Google Scholar]
- Zurita Heras, J. A., & Walter, R. 2004, ATel, 336, 1 [Google Scholar]
Appendix A: Identified lines
All Tables
Rotation velocity measurement obtained by fitting spectral line width (the associated error is of the order of 10%).
All Figures
|
Fig. 1 FORS1 spectrum of IGR J16465−4507 from 395 to 475 nm (flux axis is in arbitrary units). For comparison, a spectrum of the B0.5 I star k Ori is shown in the upper panel (Walborn & Fitzpatrick 1990). |
| In the text | |
|
Fig. 2 EMMI spectrum of IGR J16465−4507 from 570 to 710 nm (flux axis is in arbitrary units). |
| In the text | |
|
Fig. 3 SOFI/GBF spectrum of IGR J16465−4507 from 950 to 1650 nm (flux axis is in arbitrary units). Features at ~1190, 1210, and 1265 nm are due to strong atmosphere absorption in the J band. |
| In the text | |
|
Fig. 4 SOFI/GRF (H part) spectrum of IGR J16465−4507 from 1600 to 1750 nm (flux axis is in arbitrary units). The feature at ~ 1625 nm is probably due to a bad background correction at the edge of the grism. |
| In the text | |
|
Fig. 5 SOFI/GRF (Ks part) spectrum of IGR J16465−4507 from 2040 to 2200 nm. A typical B0.5 Ib spectrum is indicated at the top of the figure (flux axis is in arbitrary units for both spectra). |
| In the text | |
|
Fig. 6 X-Shooter/UVB spectrum of IGR J16465−4507 from 360 to 510 nm. DIB stands for diffuse interstellar band. |
| In the text | |
|
Fig. 7 X-Shooter/VIS spectrum of IGR J16465−4507 from 540 to 1020 nm. DIB stands for diffuse interstellar band, and T telluric lines. |
| In the text | |
|
Fig. 8 X-Shooter/NIR spectrum of IGR J16465−4507 from 990 to 2300 nm. |
| In the text | |
|
Fig. 9 Overplot of the X-Shooter spectrum of IGR J16465−4507 from 400 to 490 nm with the stellar atmosphere model fit. |
| In the text | |
|
Fig. 10 Photometric magnitudes of IGR J16465−4507, respectively before (upper panel) and after (lower panel) dereddenning. |
| In the text | |
|
Fig. 11 Upper panel: OIR SED showing photometric and spectroscopic measurements. Lower panel: same SED including the 1–100 keV X-ray component. |
| In the text | |
|
Fig. 12 Optical photometric lightcurve of IGR J16465−4507 taken with SUSI2 in the V band. |
| In the text | |
|
Fig. 13 Blue circles and green squares in this updated Corbet diagram represent wind-fed systems (sgHMXB) and BeHMXB, respectively. Red diamonds indicate SFXT; three are misplaced in this diagram: IGR J11215–5952, IGR J18483–0311, and IGR J16465−4507. RLOS stands for Roche-lobe overflow systems. |
| In the text | |
Current usage metrics show cumulative count of Article Views (full-text article views including HTML views, PDF and ePub downloads, according to the available data) and Abstracts Views on Vision4Press platform.
Data correspond to usage on the plateform after 2015. The current usage metrics is available 48-96 hours after online publication and is updated daily on week days.
Initial download of the metrics may take a while.