Fig. 11
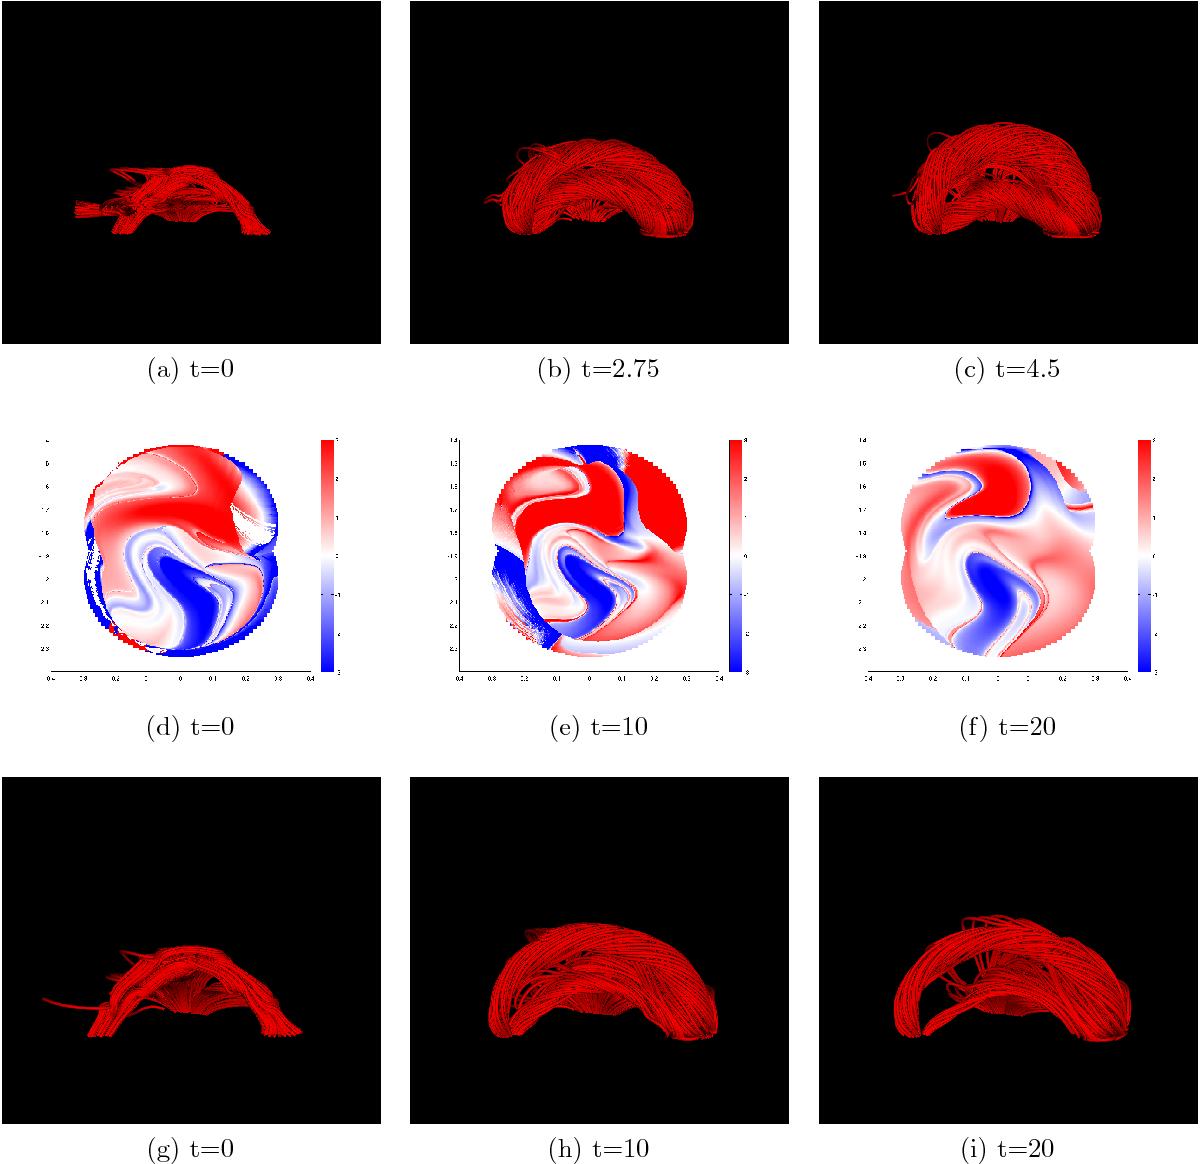
Figures depicting the tendency of the B4 field to split into two flux ropes of opposing sign. Panels a)−c) the core field shown in Figs. 10a−f as viewed from the side. Panels d)−f) local twisting distributions Lf(x,y) of the B4 field for a simulation, whose core field lines are shown in panels g)−i), and whose maximum field strength is comparable to that of the background field (the flux rope of the field in panels a)−c) is a factor 3 stronger than in panels g)−i)).
Current usage metrics show cumulative count of Article Views (full-text article views including HTML views, PDF and ePub downloads, according to the available data) and Abstracts Views on Vision4Press platform.
Data correspond to usage on the plateform after 2015. The current usage metrics is available 48-96 hours after online publication and is updated daily on week days.
Initial download of the metrics may take a while.