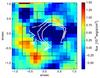
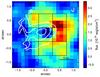
Fig. 8

Maps of the narrow component of Hα for LBQS0109 (top) and HB8903 (bottom); the white contours trace the [Oiii]λ5007 velocity blue-shift shown in Fig. 3. The contours represent the velocity –300, –275, and –250 km s-1 for LBQS0109, and –150, –100, and –50 km s-1 for HB8903. Star formation traced by Hαnar is heavily suppressed in the S–W and S–E for region for LBQS0109 and HB8903, respectively, where the outflow traced by [Oiii]λ5007 is fastest. Black squares indicate the nine regions where we extracted the corresponding H-band spectra shown in the right panels of Fig. 1.
Current usage metrics show cumulative count of Article Views (full-text article views including HTML views, PDF and ePub downloads, according to the available data) and Abstracts Views on Vision4Press platform.
Data correspond to usage on the plateform after 2015. The current usage metrics is available 48-96 hours after online publication and is updated daily on week days.
Initial download of the metrics may take a while.