Fig. 7
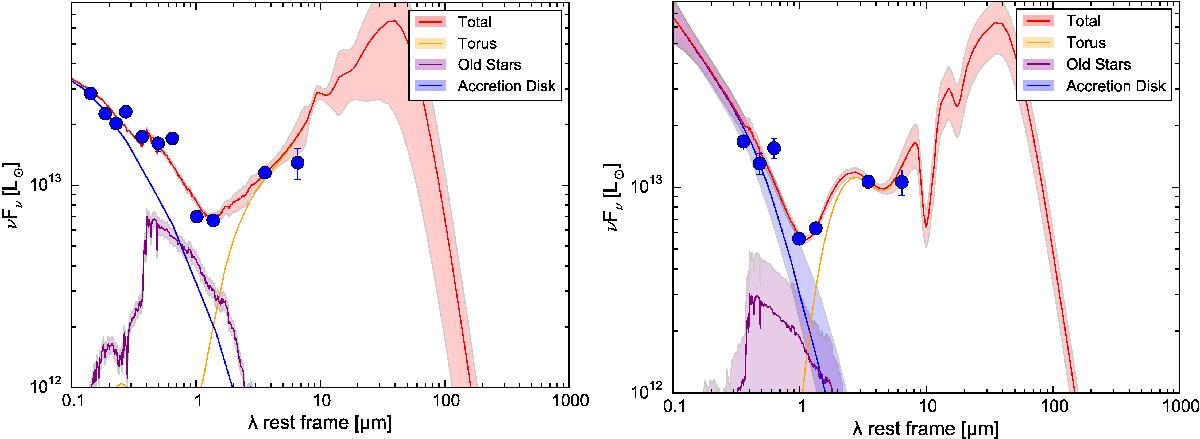
SED fitting of LBQS0109 (left) and HB8903 (right). The blue points show the QSO emission fluxes from SDSS, 2MASS, and WISE photometry. The total best-fit models are plotted in red, while accretion disk, old star, and torus components are plotted in blue, purple, and orange, respectively. The filled areas denote the uncertainties estimated with a Monte Carlo procedure, see Balmaverde et al. (2016) for more details.
Current usage metrics show cumulative count of Article Views (full-text article views including HTML views, PDF and ePub downloads, according to the available data) and Abstracts Views on Vision4Press platform.
Data correspond to usage on the plateform after 2015. The current usage metrics is available 48-96 hours after online publication and is updated daily on week days.
Initial download of the metrics may take a while.