Fig. 5
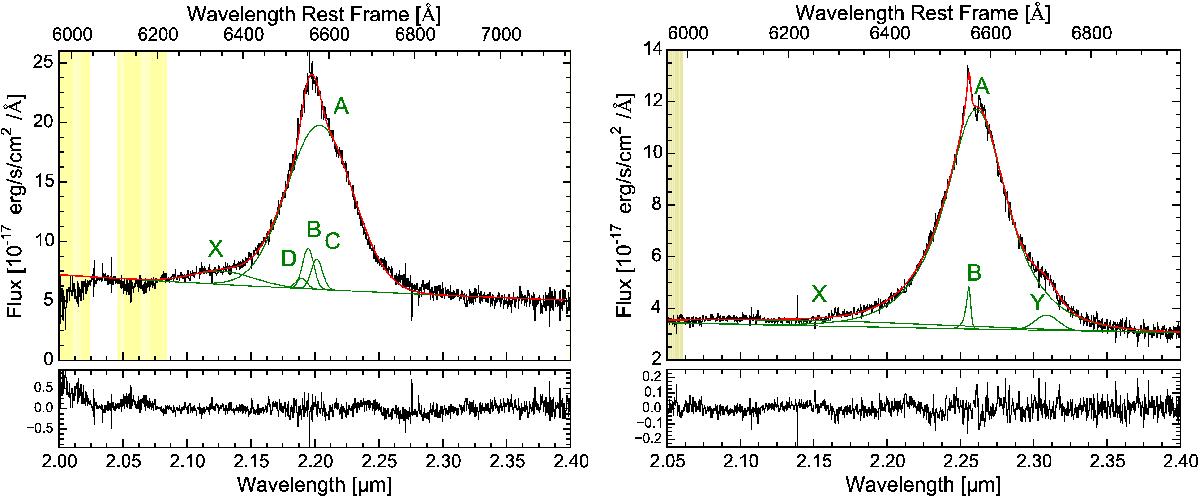
K-band SINFONI spectra of LBQS0109 (left panel) and HB8903 (right panel) in the spectral region of Hα integrated in a region of 0.25′′ × 0.25′′ (2 × 2 pixel) around the QSO. Upper panels: observed spectra shown with a black line. The different components in the fit for each line (Hα, [Nii], and continuum) are shown in green, and the red line shows the total fit. The shaded yellow regions indicate the zone affected by strong sky line residuals, which are excluded from the fit. Bottom panels: fit residuals, obtained as a difference between observed and model spectra.
Current usage metrics show cumulative count of Article Views (full-text article views including HTML views, PDF and ePub downloads, according to the available data) and Abstracts Views on Vision4Press platform.
Data correspond to usage on the plateform after 2015. The current usage metrics is available 48-96 hours after online publication and is updated daily on week days.
Initial download of the metrics may take a while.