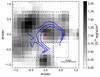
Fig. 4
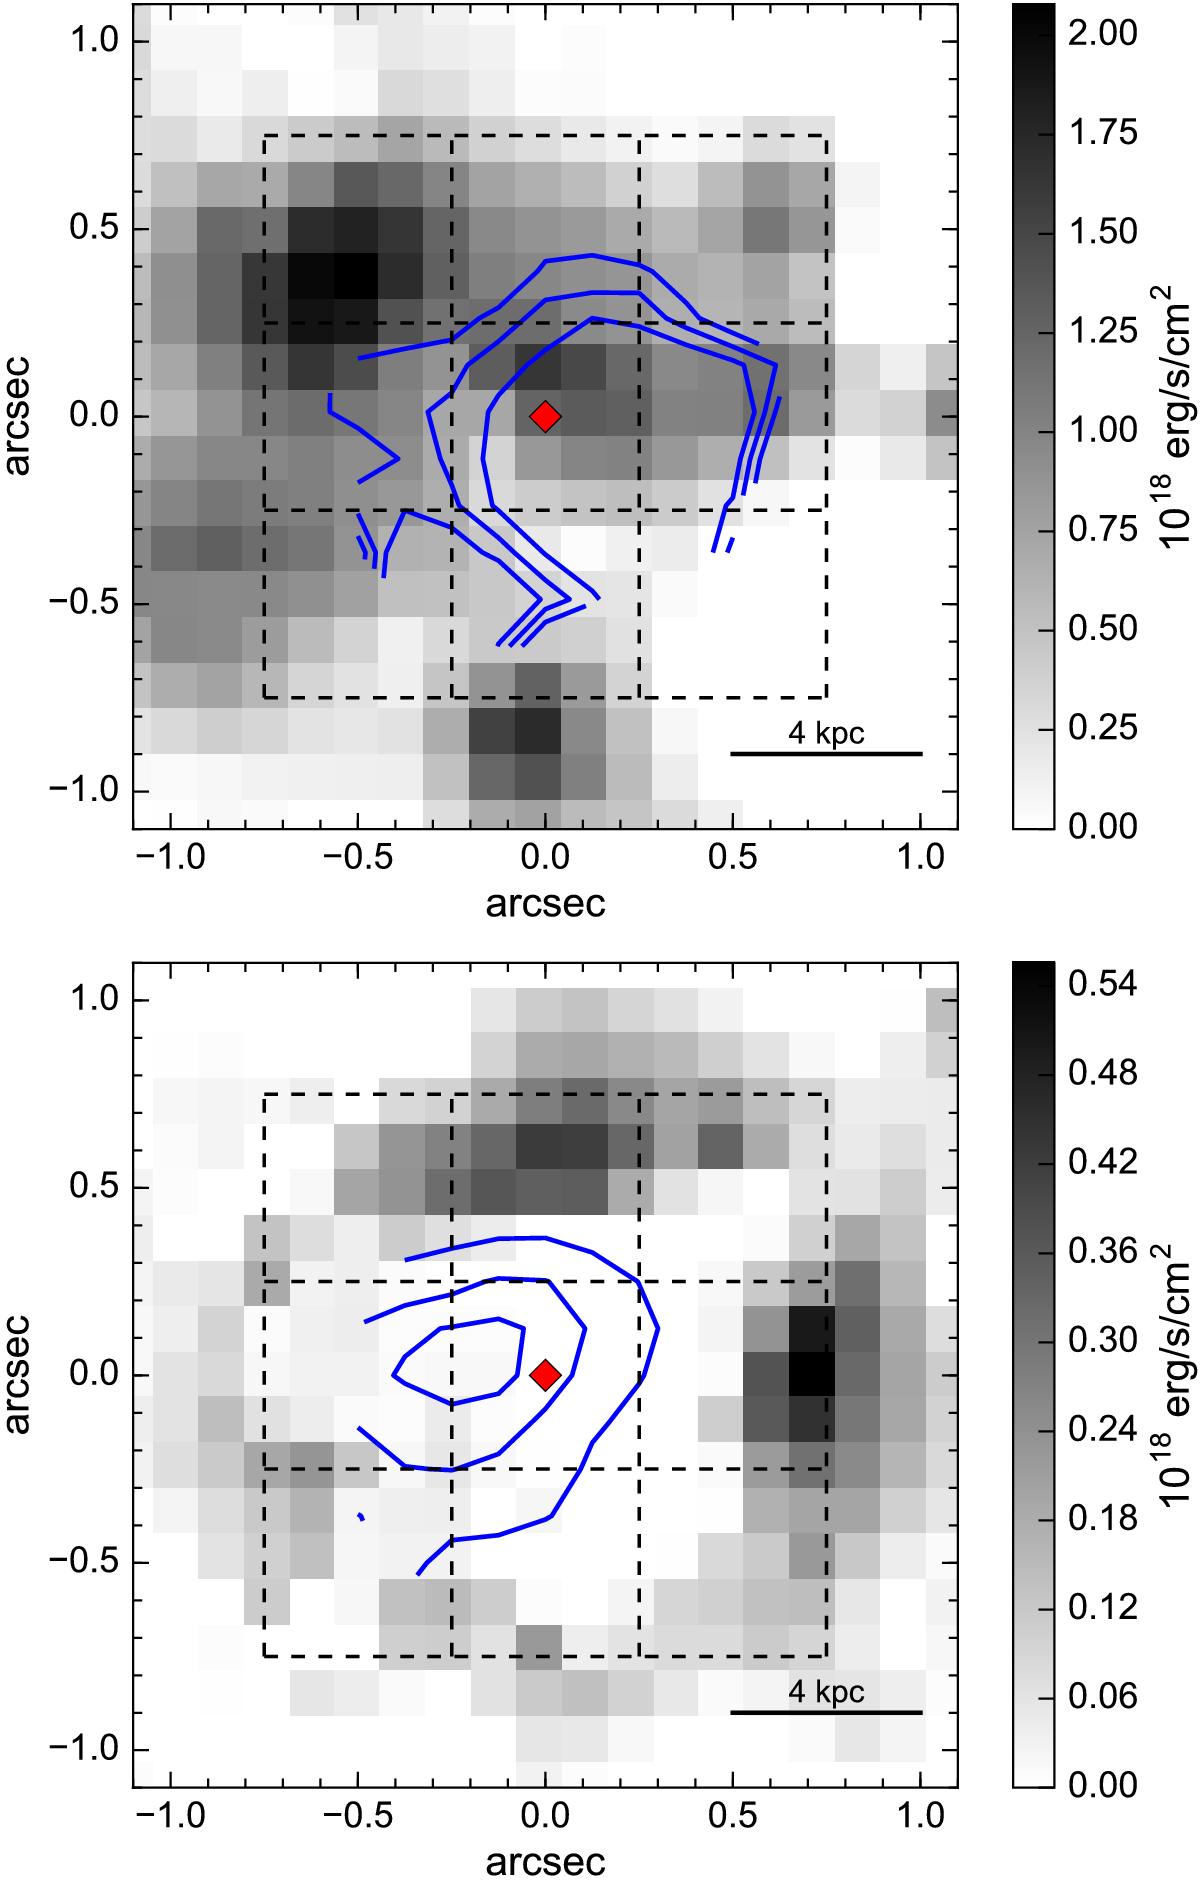
Flux maps of the [Oiii]nar component for LBQS0109 (top) and for HB8903 (bottom) obtained from the fit described in the text. The AGN position is identified with a red diamond. The blue contours trace the [Oiii]λ5007 blue-shifted emission cone shown in Fig. 3. The contours represent the velocity –300, –275 and –250 km s-1 for LBQS0109, and –125, –100 and –50 km s-1 for HB8903. The [Oiii]nar emissions are not symmetrically distributed and are anti-correlated with the outflow region. Black squares indicate the nine regions where we extracted the corresponding spectra shown in the right panels of Fig. 1.
Current usage metrics show cumulative count of Article Views (full-text article views including HTML views, PDF and ePub downloads, according to the available data) and Abstracts Views on Vision4Press platform.
Data correspond to usage on the plateform after 2015. The current usage metrics is available 48-96 hours after online publication and is updated daily on week days.
Initial download of the metrics may take a while.