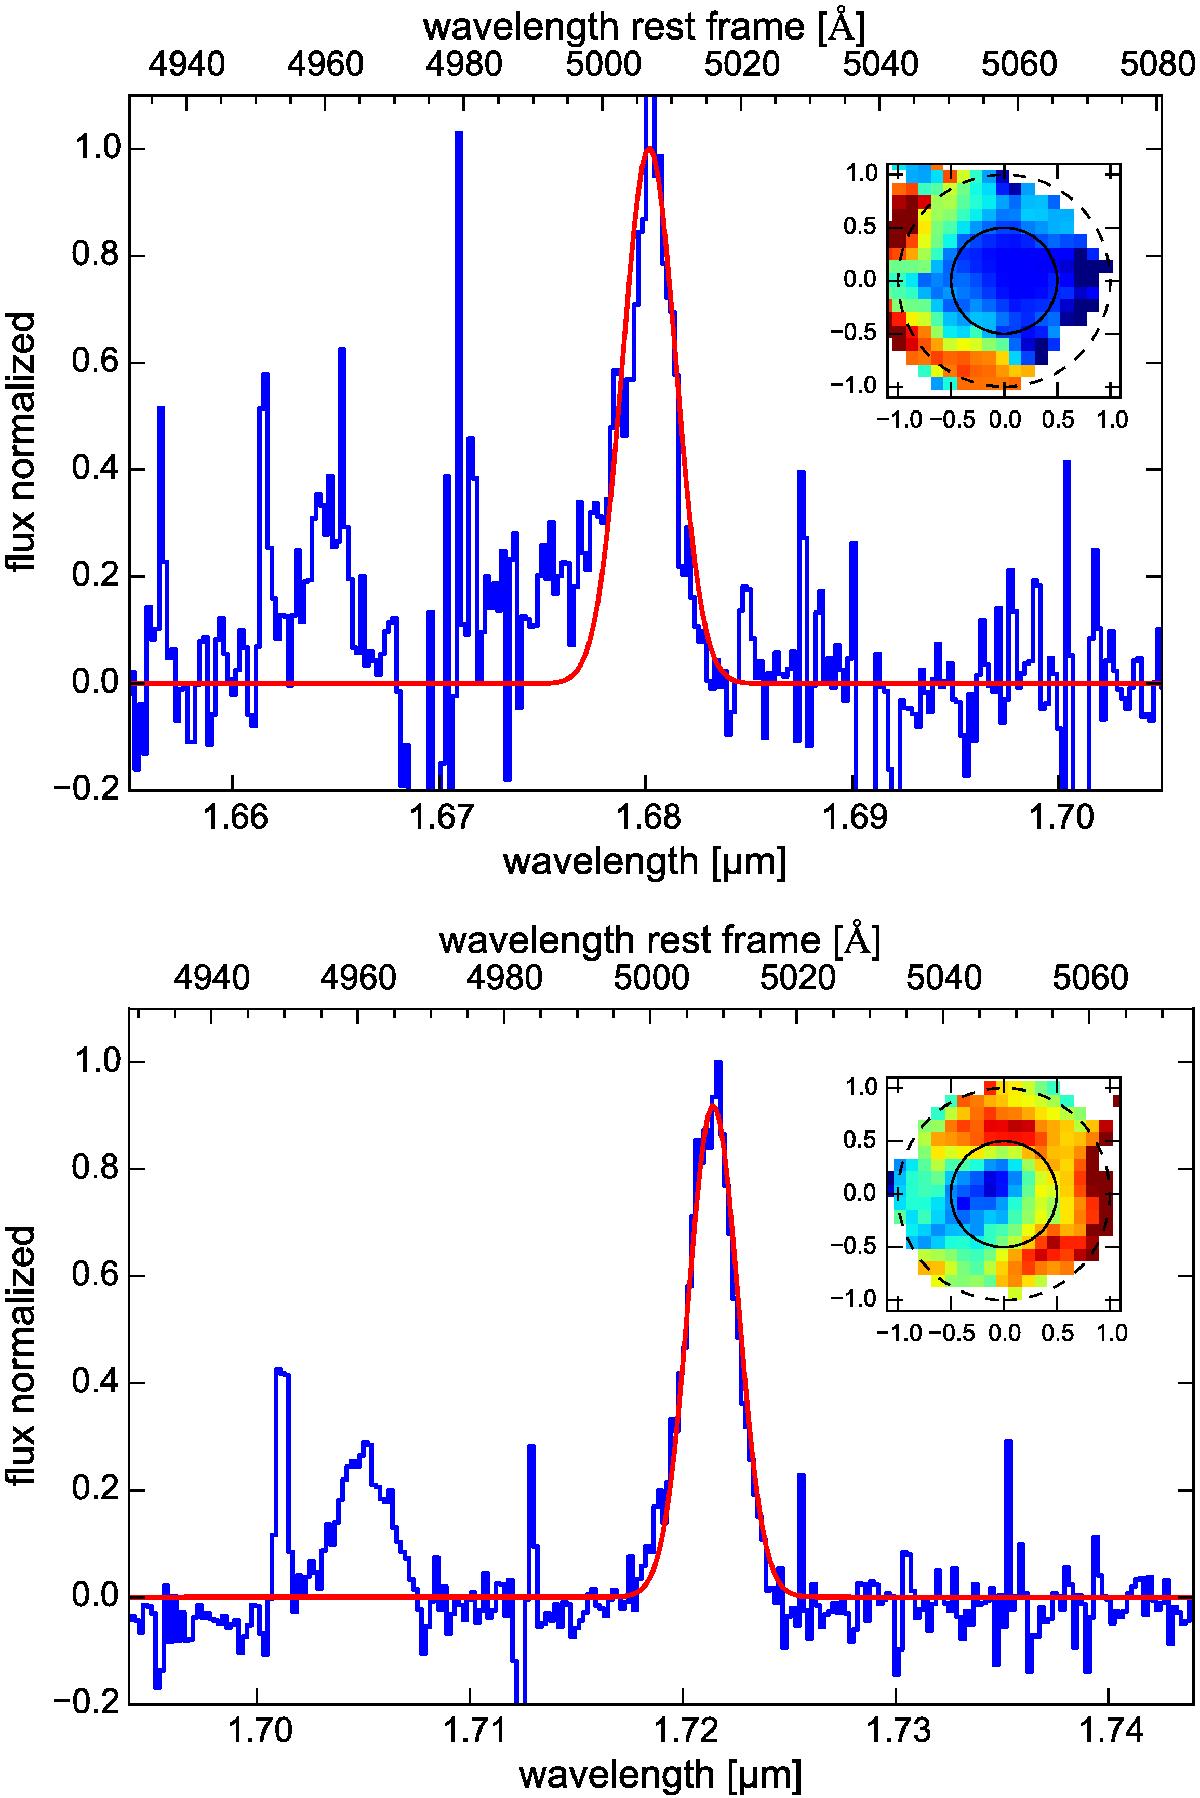
Fig. 2

H-band SINFONI spectra of LBQS0109 (top) and HB8903 (bottom). The observed spectra (blue lines) are the result of the subtraction between the spectra extracted from the ring-shaped regions (0.5′′ <r< 1′′) and from the nuclear regions (r< 0.5′′). The narrow doublet [Oiii]λ5007 is evident in both sources. The red curves denote the Gaussian fits whose parameters are shown in Table 2. In the smaller inset, the nuclear region (solid black line) and the ring-shaped region (dashed black line) are drawn in the [Oiii]λ5007 velocity maps.
Current usage metrics show cumulative count of Article Views (full-text article views including HTML views, PDF and ePub downloads, according to the available data) and Abstracts Views on Vision4Press platform.
Data correspond to usage on the plateform after 2015. The current usage metrics is available 48-96 hours after online publication and is updated daily on week days.
Initial download of the metrics may take a while.


