Fig. 1
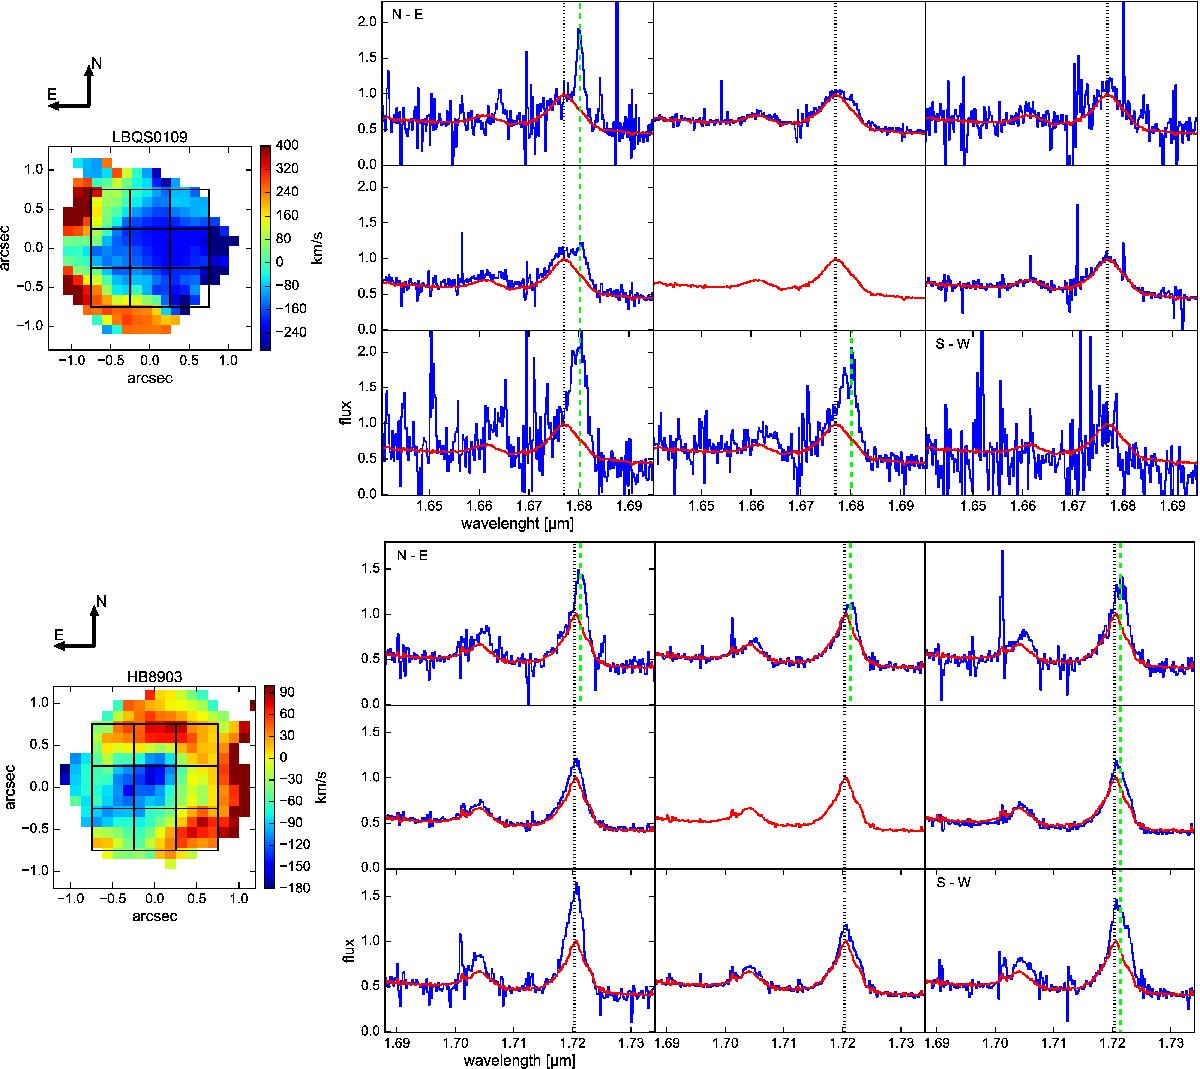
Left panels: [Oiii]λ5007 velocity maps of LBQS0109 (top) and HB8903 (bottom) presented in Paper I. Black squares indicate the nine regions where we extracted the corresponding spectra shown in the right panels. Right panels: comparison between the nuclear [Oiii]λ5007 profiles (red) and those from the external regions (blue) of LBQS0109 (top) and HB8903 (bottom). The black dotted line corresponds to the [Oiii]λ5007 central wavelength. Narrow (FWHM ~ 490 km s-1 for LBQS0109 and FWHM ~ 480 km s-1 for HB8903) components of the [Oiii]λ5007 emission, identified by the green dashed line, are clearly detected.
Current usage metrics show cumulative count of Article Views (full-text article views including HTML views, PDF and ePub downloads, according to the available data) and Abstracts Views on Vision4Press platform.
Data correspond to usage on the plateform after 2015. The current usage metrics is available 48-96 hours after online publication and is updated daily on week days.
Initial download of the metrics may take a while.