Fig. 9
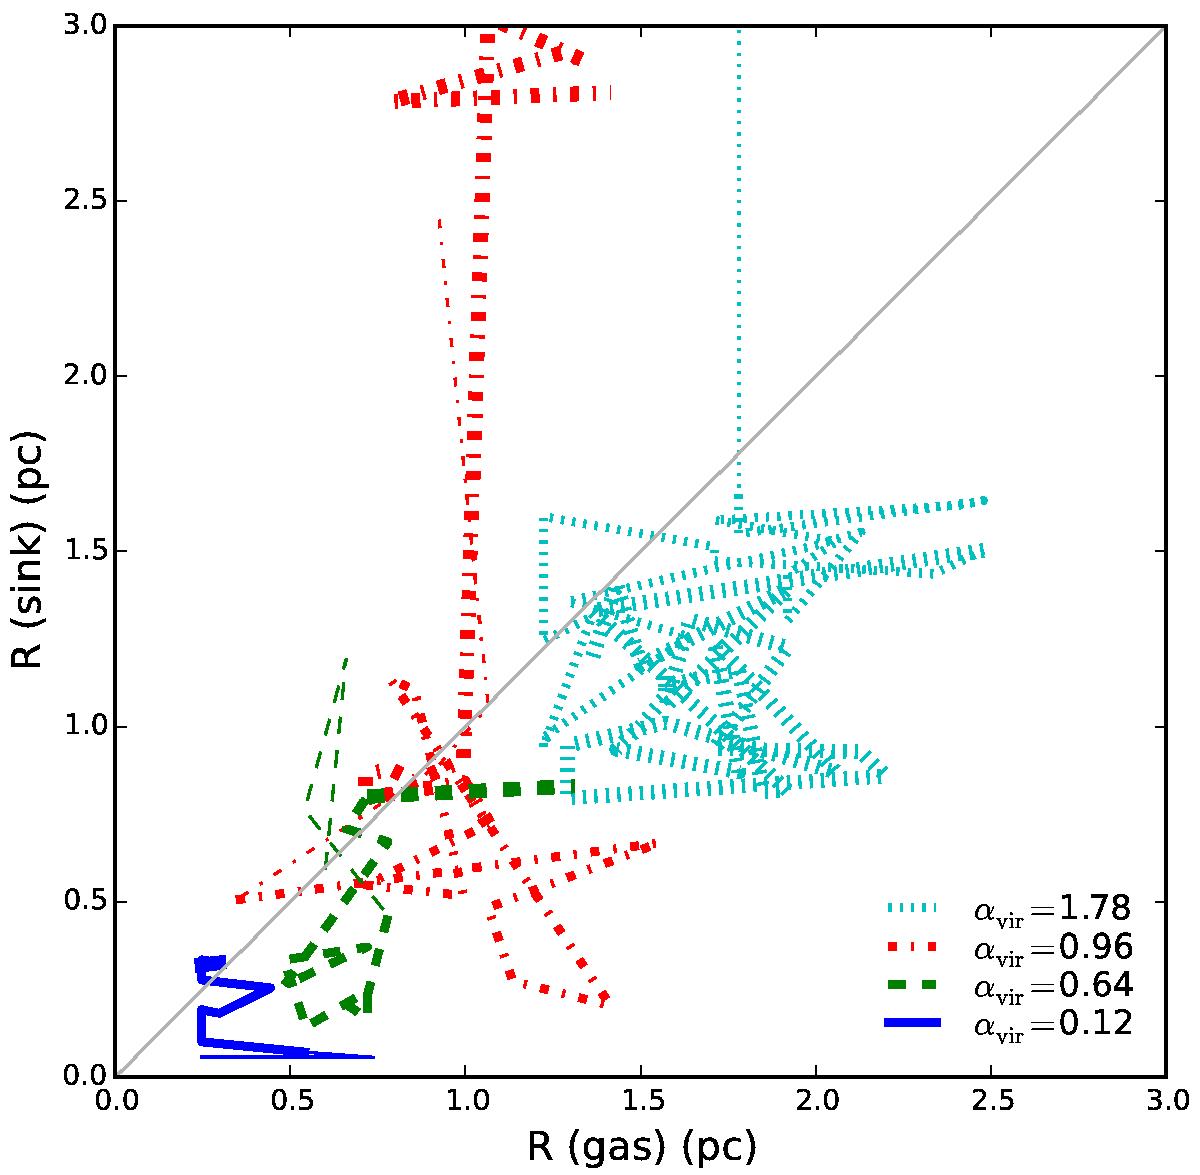
Radius of sink clusters plotted against radius of gas protoclusters for four runs. The relations are plotted with thinner lines for time before 2 Myr and with thicker lines after 3 Myr. The color coding is the same as that in Fig. 8. The gas and sink cluster sizes show good correlation in general, while the sink cluster size is slightly smaller than that of the gas cluster.
Current usage metrics show cumulative count of Article Views (full-text article views including HTML views, PDF and ePub downloads, according to the available data) and Abstracts Views on Vision4Press platform.
Data correspond to usage on the plateform after 2015. The current usage metrics is available 48-96 hours after online publication and is updated daily on week days.
Initial download of the metrics may take a while.