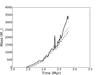
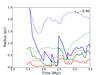
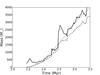
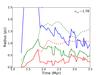
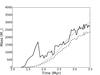
Fig. 6
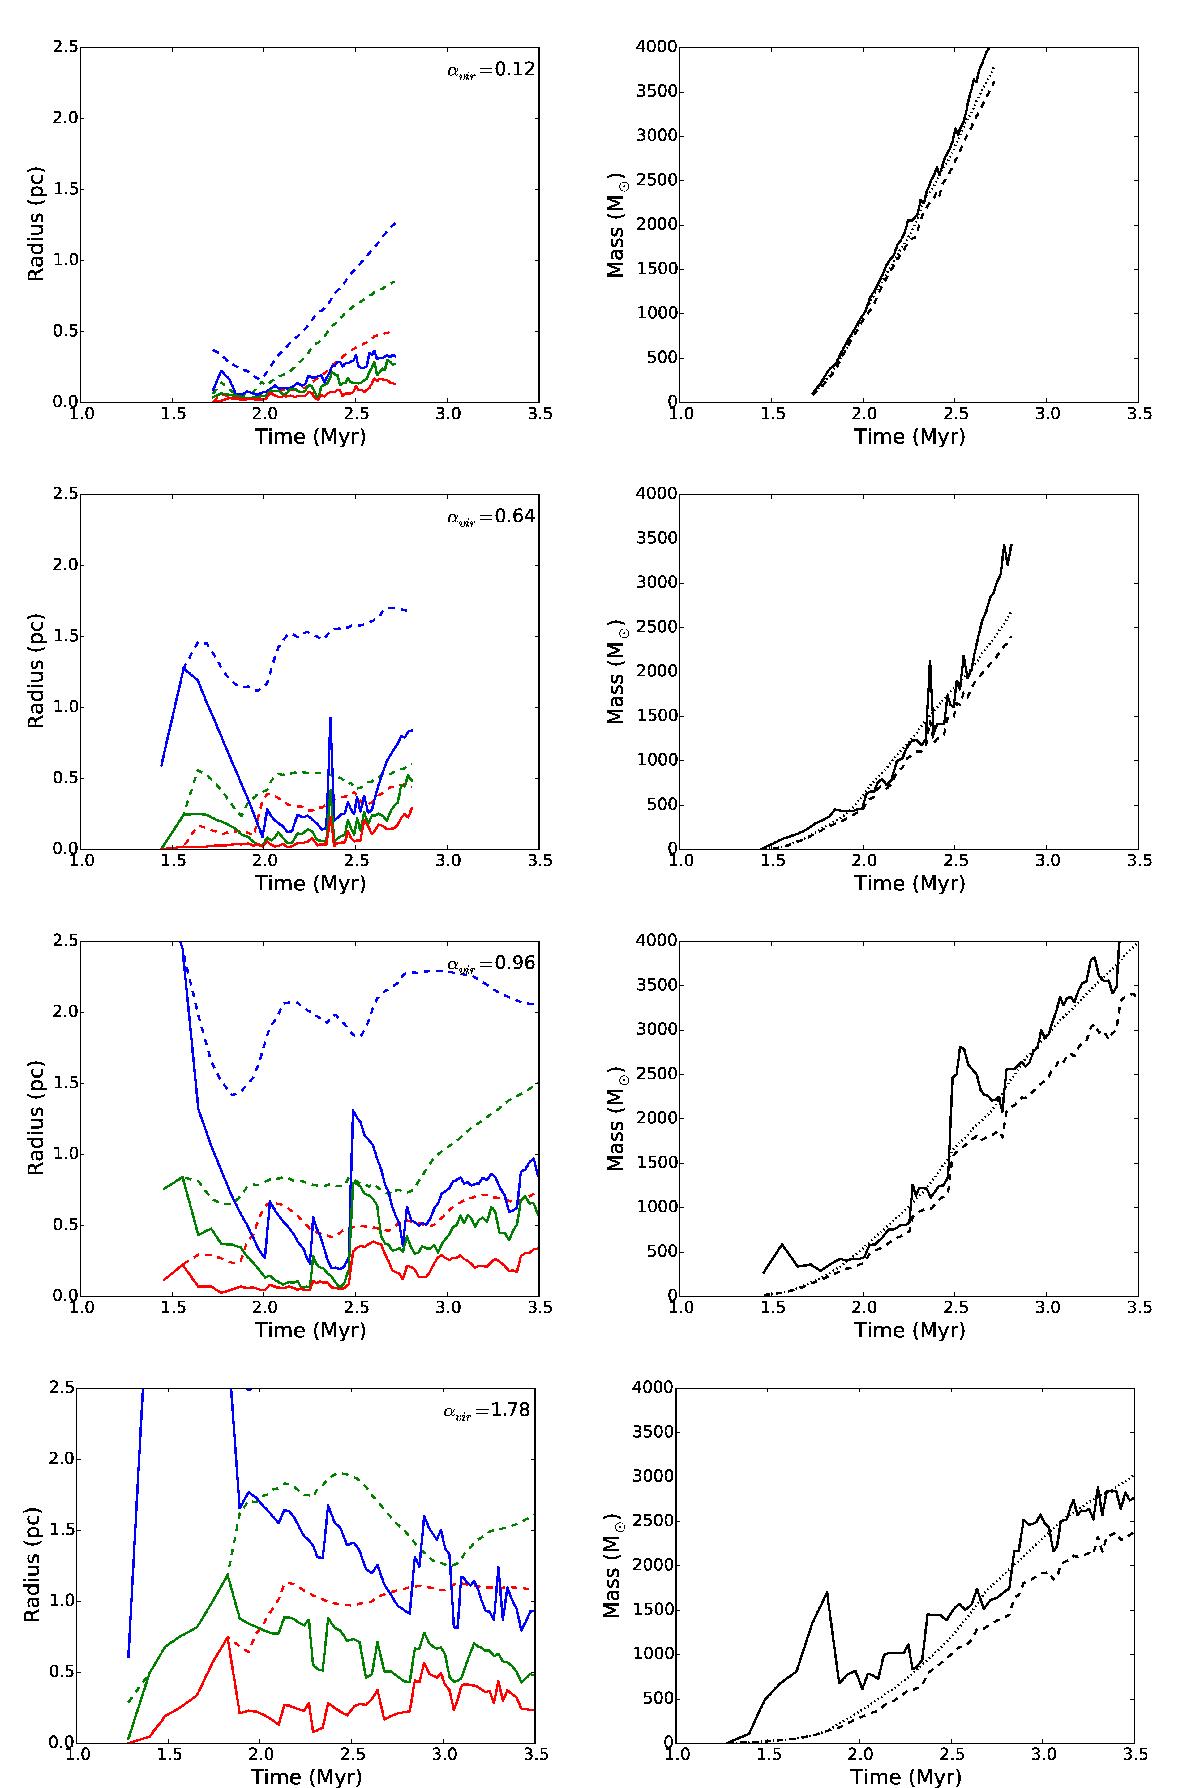
Time evolution of the three semiaxes of the cluster determined with sink particles in the left column. The dashed curves and solid curves represent the values calculated with all sinks and the reduced values with distant sinks omitted, respectively. The sink mass (dashed) and total mass (solid) inside cluster region defined with sink distributions are plotted against time in the right column. The dotted line represents the sink mass before sink removal. Removing the sink particles far away from the center drastically reduces the size while only mildly decreasing the total mass. From top to bottom are runs A, B, C, and D with increasing levels of turbulence.
Current usage metrics show cumulative count of Article Views (full-text article views including HTML views, PDF and ePub downloads, according to the available data) and Abstracts Views on Vision4Press platform.
Data correspond to usage on the plateform after 2015. The current usage metrics is available 48-96 hours after online publication and is updated daily on week days.
Initial download of the metrics may take a while.