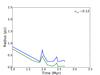
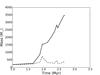
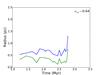
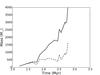
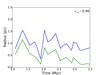
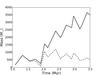
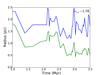
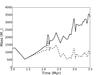
Fig. 5

Time evolution of the semiaxes R and H of the ellipsoidal gas cluster in the left column. In the right column, the cluster mass is shown as function of time. The two curves represent the gas mass (dashed) and that plus the sink mass (solid) inside the ellipsoidal region defined with gas kinematics. From top to bottom are runs A, B, C, and D with increasing levels of turbulence. The protocluster size increases with turbulence level. Most of the mass is accreted onto the sinks while the cluster mass increases in time, therefore the gas mass stays roughly constant.
Current usage metrics show cumulative count of Article Views (full-text article views including HTML views, PDF and ePub downloads, according to the available data) and Abstracts Views on Vision4Press platform.
Data correspond to usage on the plateform after 2015. The current usage metrics is available 48-96 hours after online publication and is updated daily on week days.
Initial download of the metrics may take a while.