Fig. 4
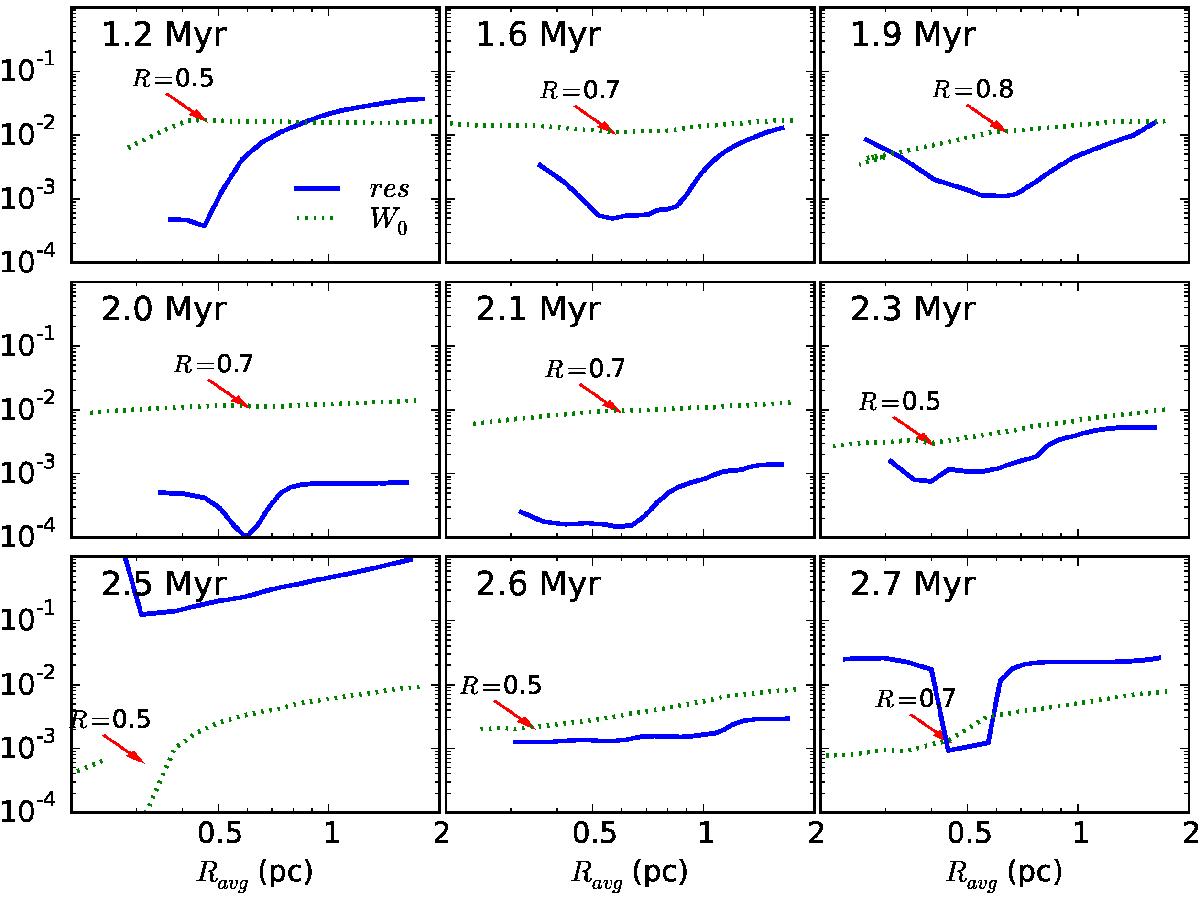
Examples of the piecewise fit at nine time steps for the run with tff/tvct = 0.9. The normalized residual is plotted as function of cluster characteristic radius ![]() in blue solid curves, of which the optimal value is such that the fit is the best. The infall moment W0(Ravg) is shown in arbitrary units with green dotted curves. The gaseous protocluster radius at which there exists a change in slope is indicated with a red arrow and the size of the semimajor axis is indicated.
in blue solid curves, of which the optimal value is such that the fit is the best. The infall moment W0(Ravg) is shown in arbitrary units with green dotted curves. The gaseous protocluster radius at which there exists a change in slope is indicated with a red arrow and the size of the semimajor axis is indicated.
Current usage metrics show cumulative count of Article Views (full-text article views including HTML views, PDF and ePub downloads, according to the available data) and Abstracts Views on Vision4Press platform.
Data correspond to usage on the plateform after 2015. The current usage metrics is available 48-96 hours after online publication and is updated daily on week days.
Initial download of the metrics may take a while.