Free Access
Fig. B.1
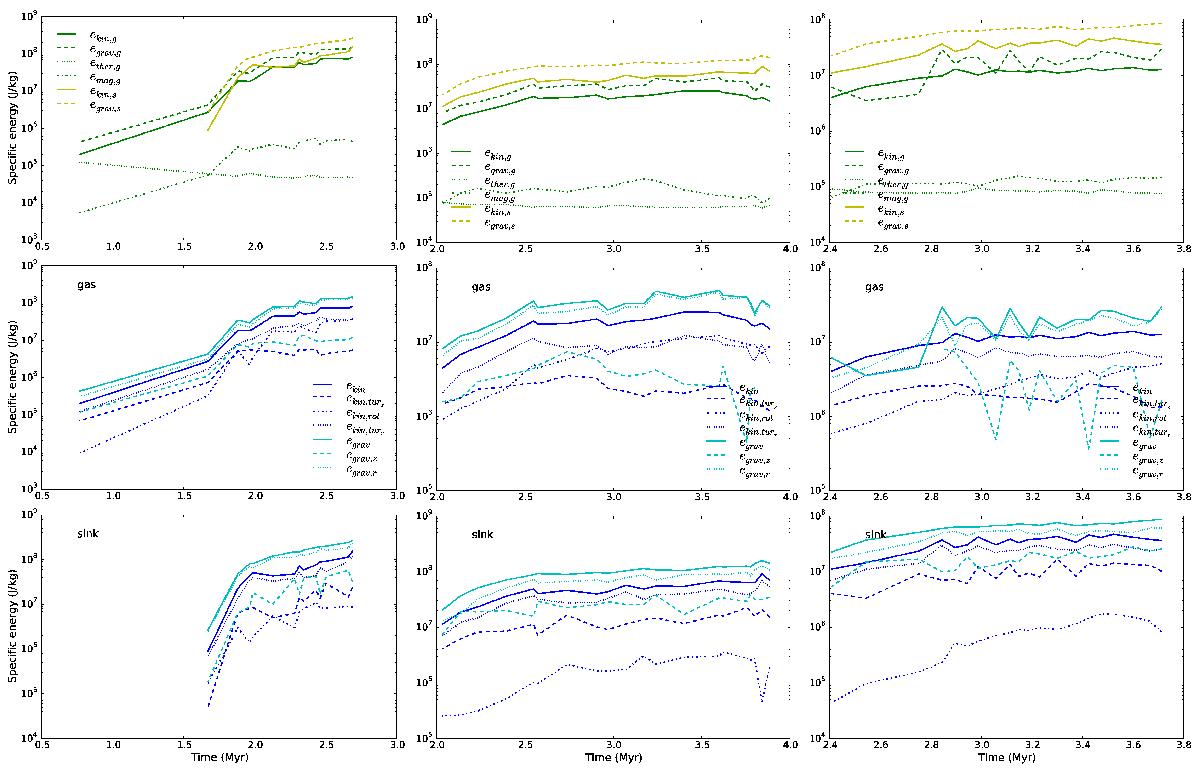
Same plot as that in Fig. 11 for other runs. From left to right are runs with tff/tvct = 0.4,1.1, and 1.5. Top panel: specific energy in various forms of the gas and sink components. Middle and bottom panels: dimensional energy analysis for gas and sinks respectively.
This figure is made of several images, please see below:
Current usage metrics show cumulative count of Article Views (full-text article views including HTML views, PDF and ePub downloads, according to the available data) and Abstracts Views on Vision4Press platform.
Data correspond to usage on the plateform after 2015. The current usage metrics is available 48-96 hours after online publication and is updated daily on week days.
Initial download of the metrics may take a while.