Fig. 11
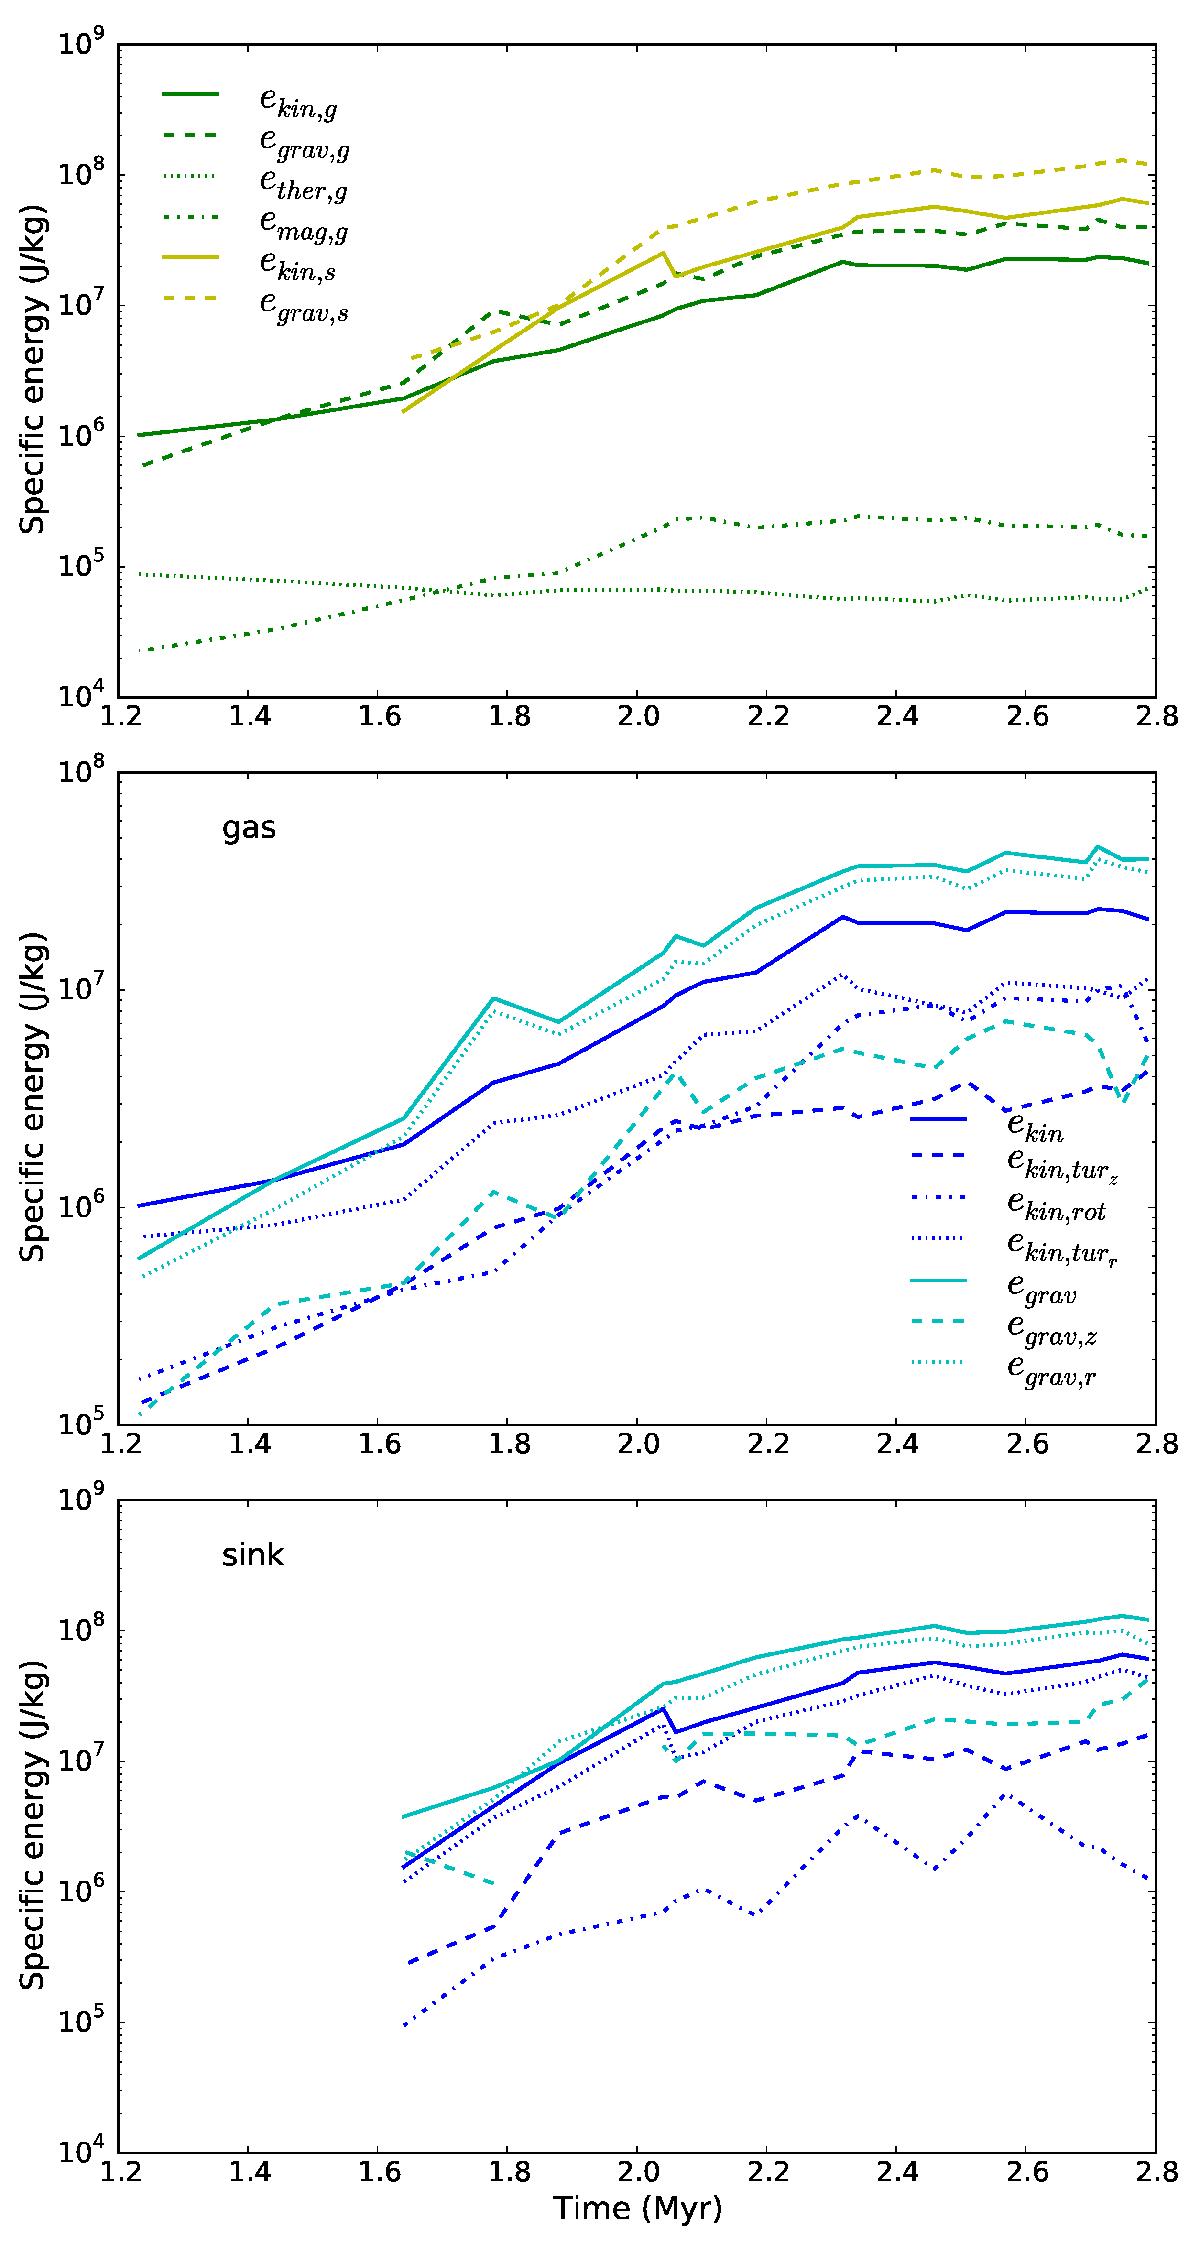
Top: different forms of specific energy of the cluster defined with gas kinematics plotted against time. The gas component is plotted in green and the sinks are plotted in yellow. The solid, dashed, dotted, and dash-dotted lines represent kinetic, gravitational, thermal, and magnetic energies respectively. The gravitational energy is plotted in absolute value. Middle and bottom: kinetic (blue) and gravitational energy (cyan) decomposition of the gas component (middle panel) and the sink component (bottom panel) of the protocluster plotted in specific values. Total energy, energy along z-axis, rotational energy, and energy perpendicular to z-axis are plotted with solid lines, dashed lines, dash-dotted lines, and dotted lines respectively.
Current usage metrics show cumulative count of Article Views (full-text article views including HTML views, PDF and ePub downloads, according to the available data) and Abstracts Views on Vision4Press platform.
Data correspond to usage on the plateform after 2015. The current usage metrics is available 48-96 hours after online publication and is updated daily on week days.
Initial download of the metrics may take a while.