Fig. 10
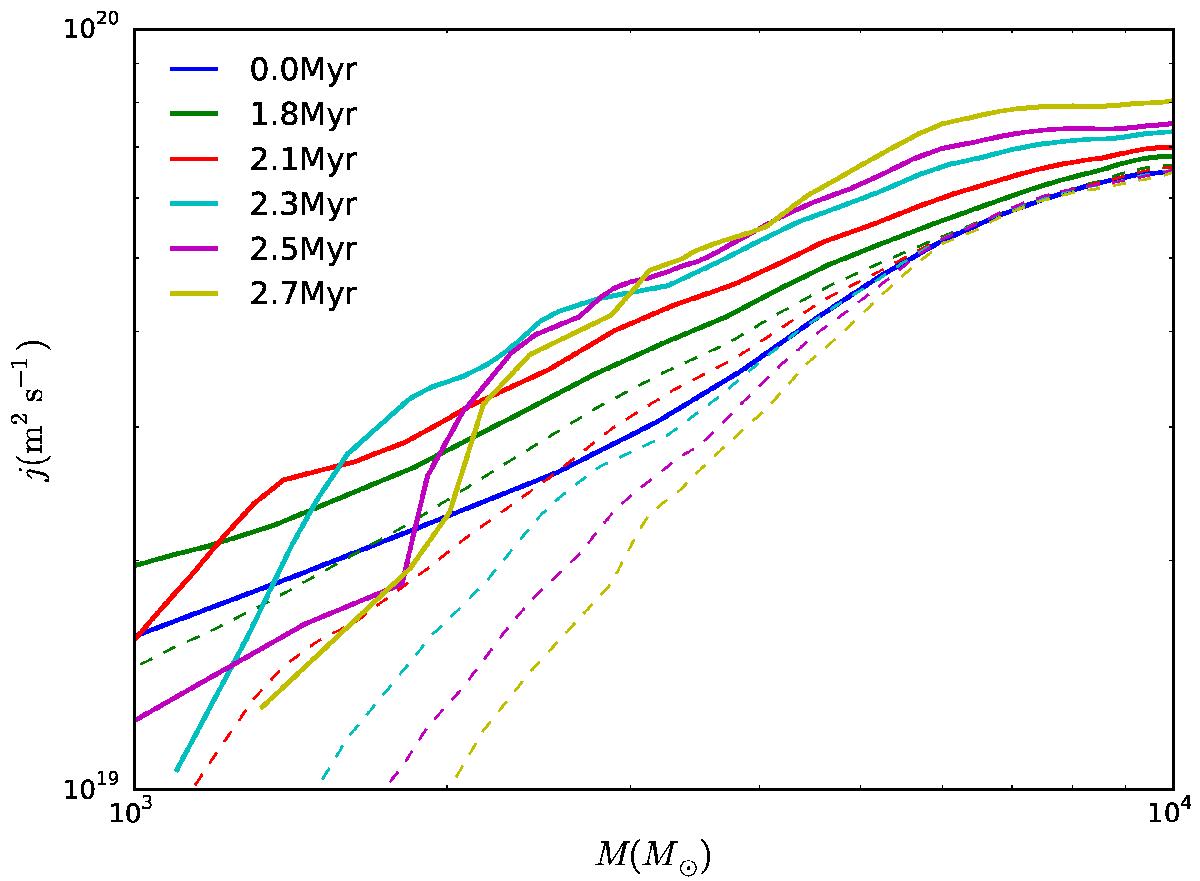
The specific angular momentum plotted against mass contained inside ellipsoids of varying radius at a series of time steps of run B. Solid curves represent the specific angular momentum of gas. Dashed curves represent the averaged value considering gas and sinks at the same time. The specific angular momentum of gas is more or less conserved during the collapse, which justifies our simplification, while the sink particles exhibit a loss in angular momentum.
Current usage metrics show cumulative count of Article Views (full-text article views including HTML views, PDF and ePub downloads, according to the available data) and Abstracts Views on Vision4Press platform.
Data correspond to usage on the plateform after 2015. The current usage metrics is available 48-96 hours after online publication and is updated daily on week days.
Initial download of the metrics may take a while.