Fig. 1
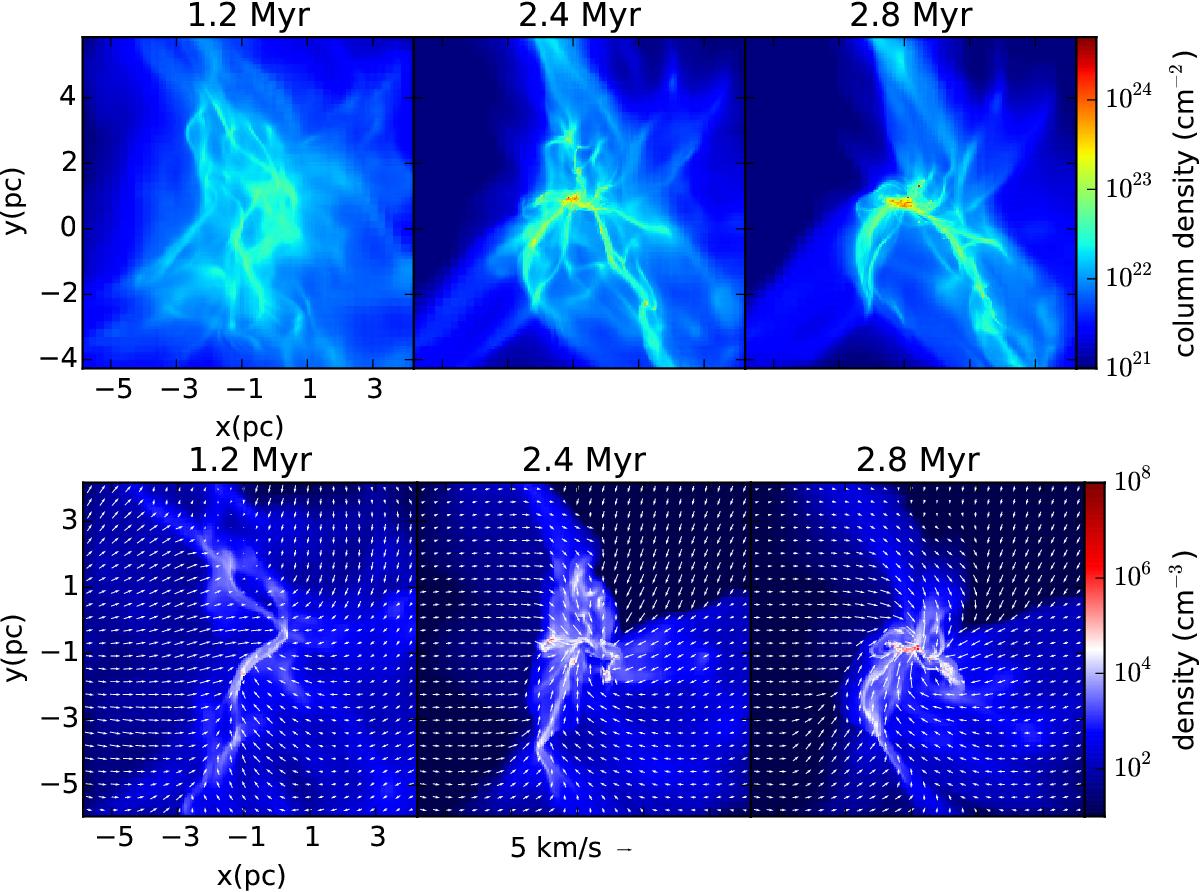
Zoomed images of run B at times 1.2, 2.4, and 2.8 Myr, showing the central dense objet. Upper panel: column density. Lower panel: velocity field overplotted on density sliced map. The origin of the coordinate corresponds to the center of the computational box and the figures are recentered such that the densest cell in the rightmost panel is at the center of the image. Sink particles are not shown.
Current usage metrics show cumulative count of Article Views (full-text article views including HTML views, PDF and ePub downloads, according to the available data) and Abstracts Views on Vision4Press platform.
Data correspond to usage on the plateform after 2015. The current usage metrics is available 48-96 hours after online publication and is updated daily on week days.
Initial download of the metrics may take a while.