Fig. 5
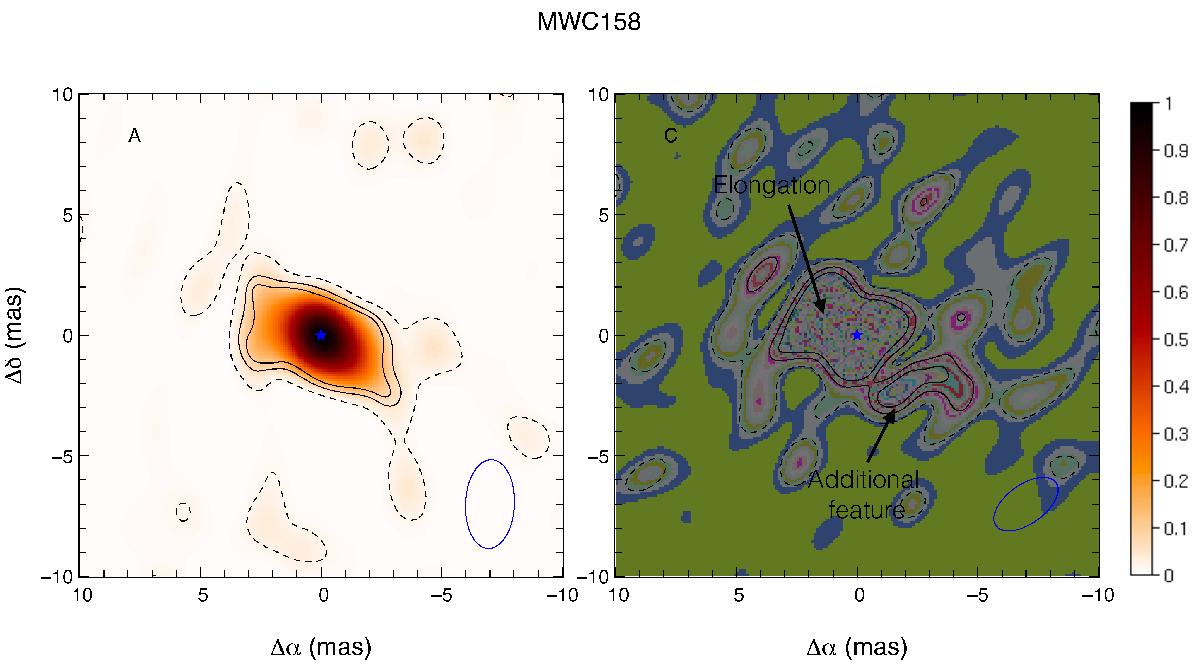
Image reconstructions in H-band on PIONIER data, epochs A (left) and C (right). The colour bar on the right was redefined to have the maximum flux equal to one for the sake of readability. The beam for each epoch is plotted in blue in the bottom right corner of the images. The contours are at 1σ (dashed line), 3, and 5σ (solid lines) significance levels.
Current usage metrics show cumulative count of Article Views (full-text article views including HTML views, PDF and ePub downloads, according to the available data) and Abstracts Views on Vision4Press platform.
Data correspond to usage on the plateform after 2015. The current usage metrics is available 48-96 hours after online publication and is updated daily on week days.
Initial download of the metrics may take a while.