Fig. E.1
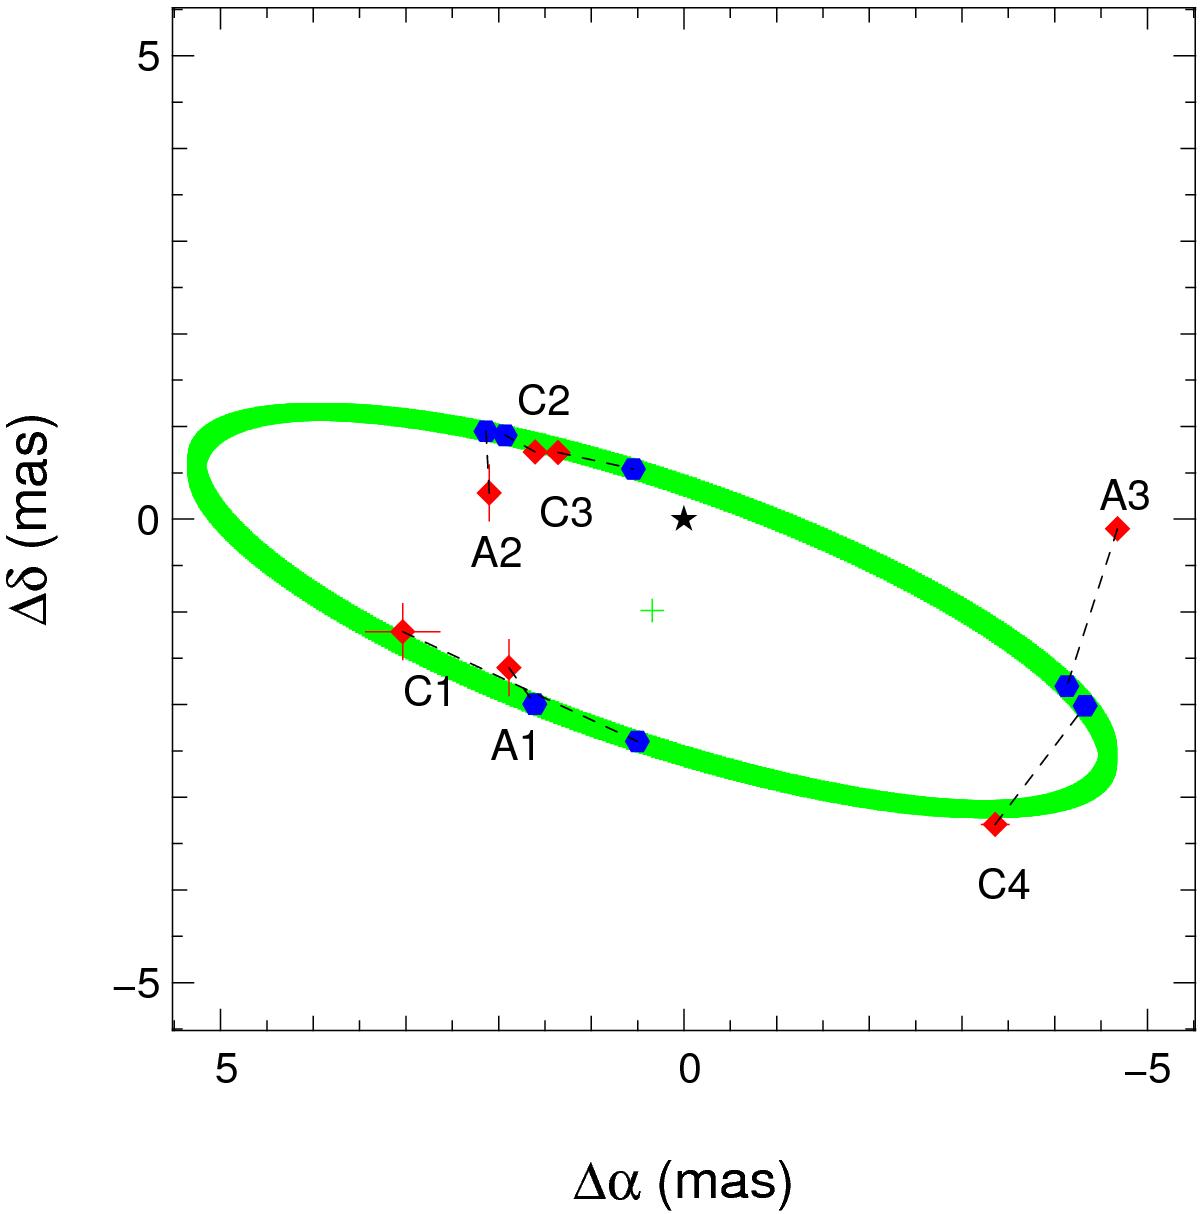
Best-fit parameters of the circular trajectory. The red diamonds represent the positions of the asymmetry from the best fits. The blue hexagons represent the positions of the asymmetry for the best-fit trajectory. The black star represents the location of the central star. The green ellipse represents the fitted trajectory and the green cross shows its centre.
Current usage metrics show cumulative count of Article Views (full-text article views including HTML views, PDF and ePub downloads, according to the available data) and Abstracts Views on Vision4Press platform.
Data correspond to usage on the plateform after 2015. The current usage metrics is available 48-96 hours after online publication and is updated daily on week days.
Initial download of the metrics may take a while.