Free Access
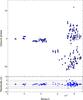
Fig. D.4
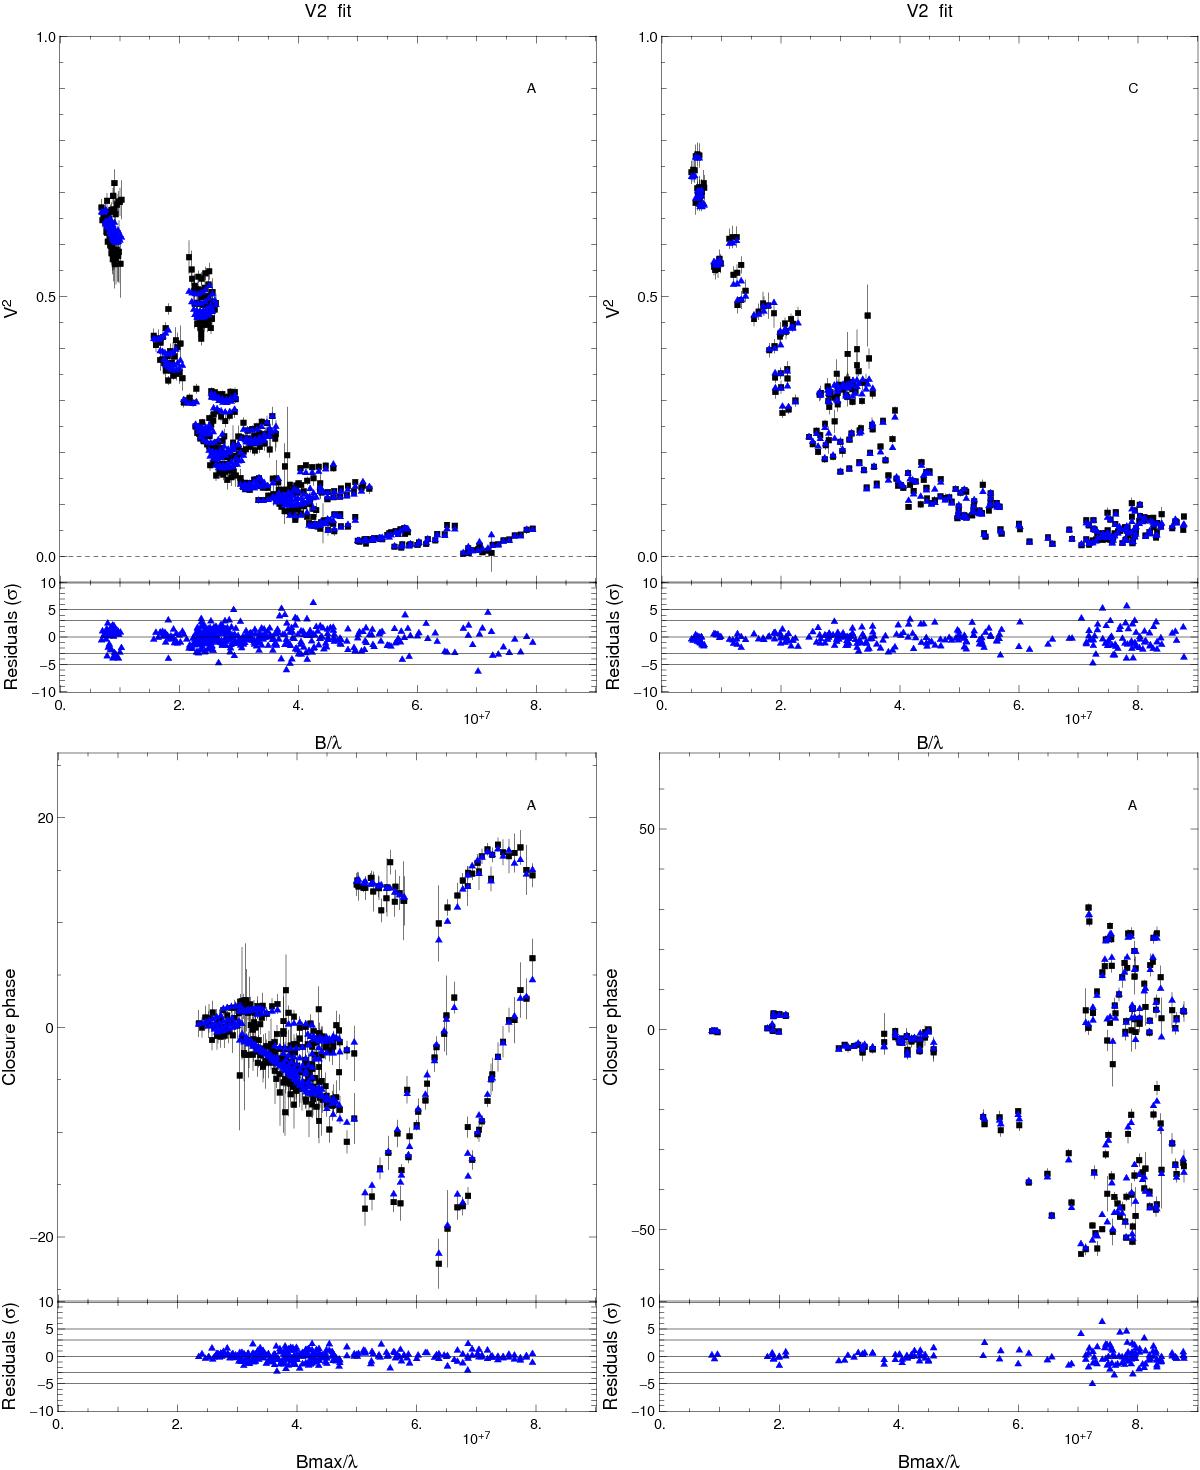
Image reconstruction fit to the dataset on V2 (top) and on CP (bottom) for epoch A (left) and C (right). The black squares represent the data and the blue triangles represent the image reconstruction fit. The residuals normalised to the standard deviation are plotted in the bottom of each graph.
This figure is made of several images, please see below:
Current usage metrics show cumulative count of Article Views (full-text article views including HTML views, PDF and ePub downloads, according to the available data) and Abstracts Views on Vision4Press platform.
Data correspond to usage on the plateform after 2015. The current usage metrics is available 48-96 hours after online publication and is updated daily on week days.
Initial download of the metrics may take a while.