Fig. D.3
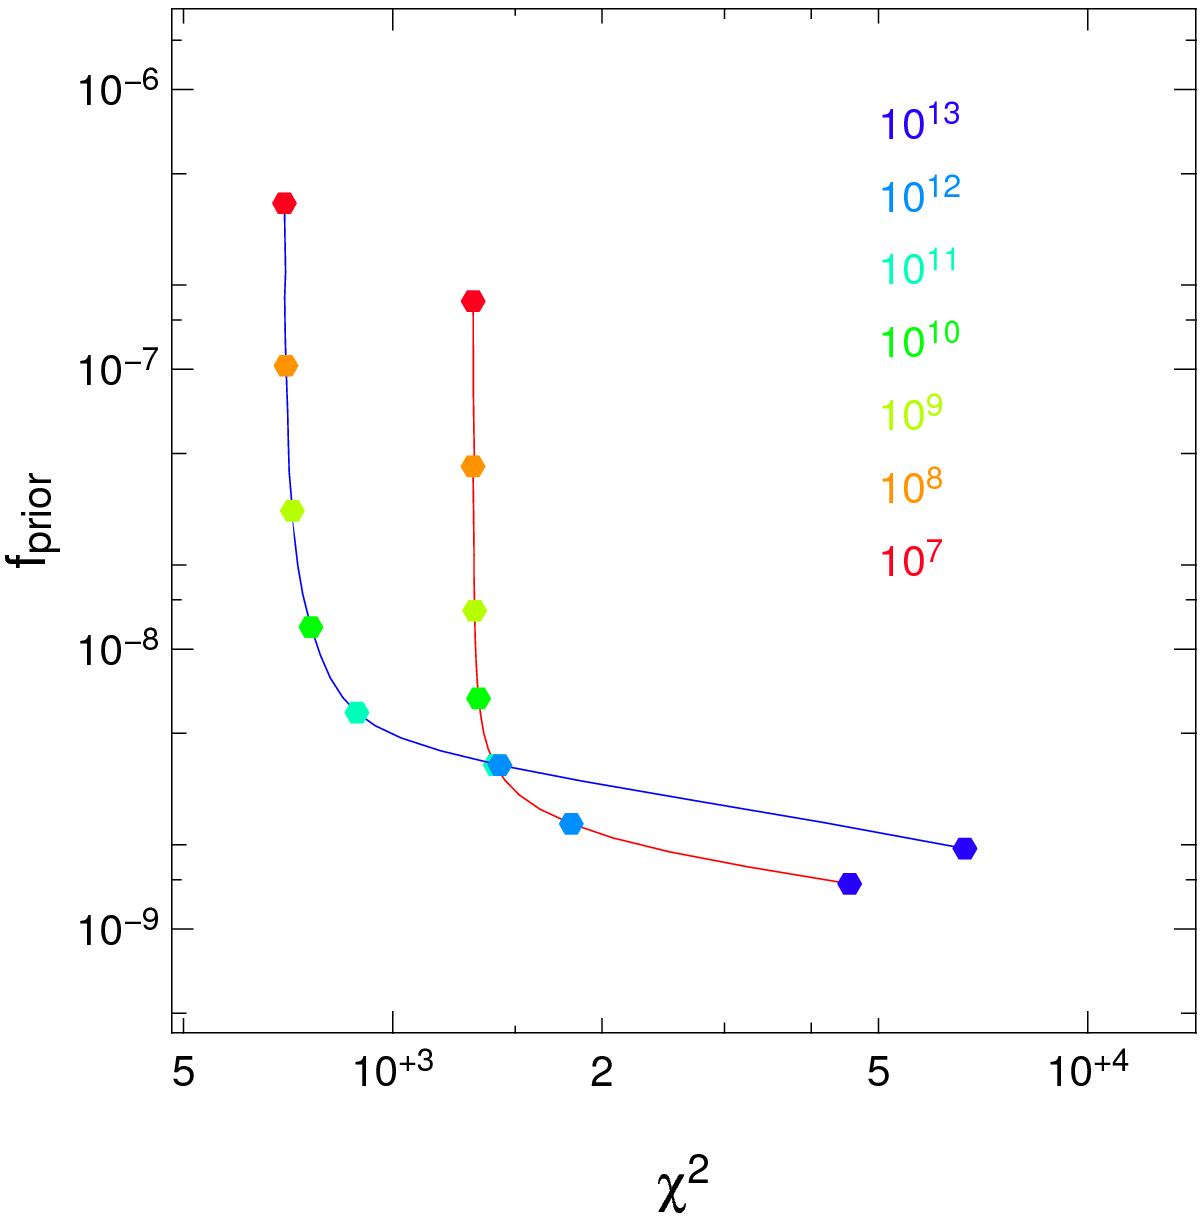
Determination of the regularisation weight μ by the L-curve method. The reconstructions were performed on a grid of weights (logarithmic grid of 25 values from 107 to 1013) for the two epochs (A in red and C in blue). For each reconstruction, the values of χ2 and fprior were traced in this graph. The best value of the weight is that in the shoulder of the curves. We have chosen 1010 for both epochs.
Current usage metrics show cumulative count of Article Views (full-text article views including HTML views, PDF and ePub downloads, according to the available data) and Abstracts Views on Vision4Press platform.
Data correspond to usage on the plateform after 2015. The current usage metrics is available 48-96 hours after online publication and is updated daily on week days.
Initial download of the metrics may take a while.