Fig. D.1
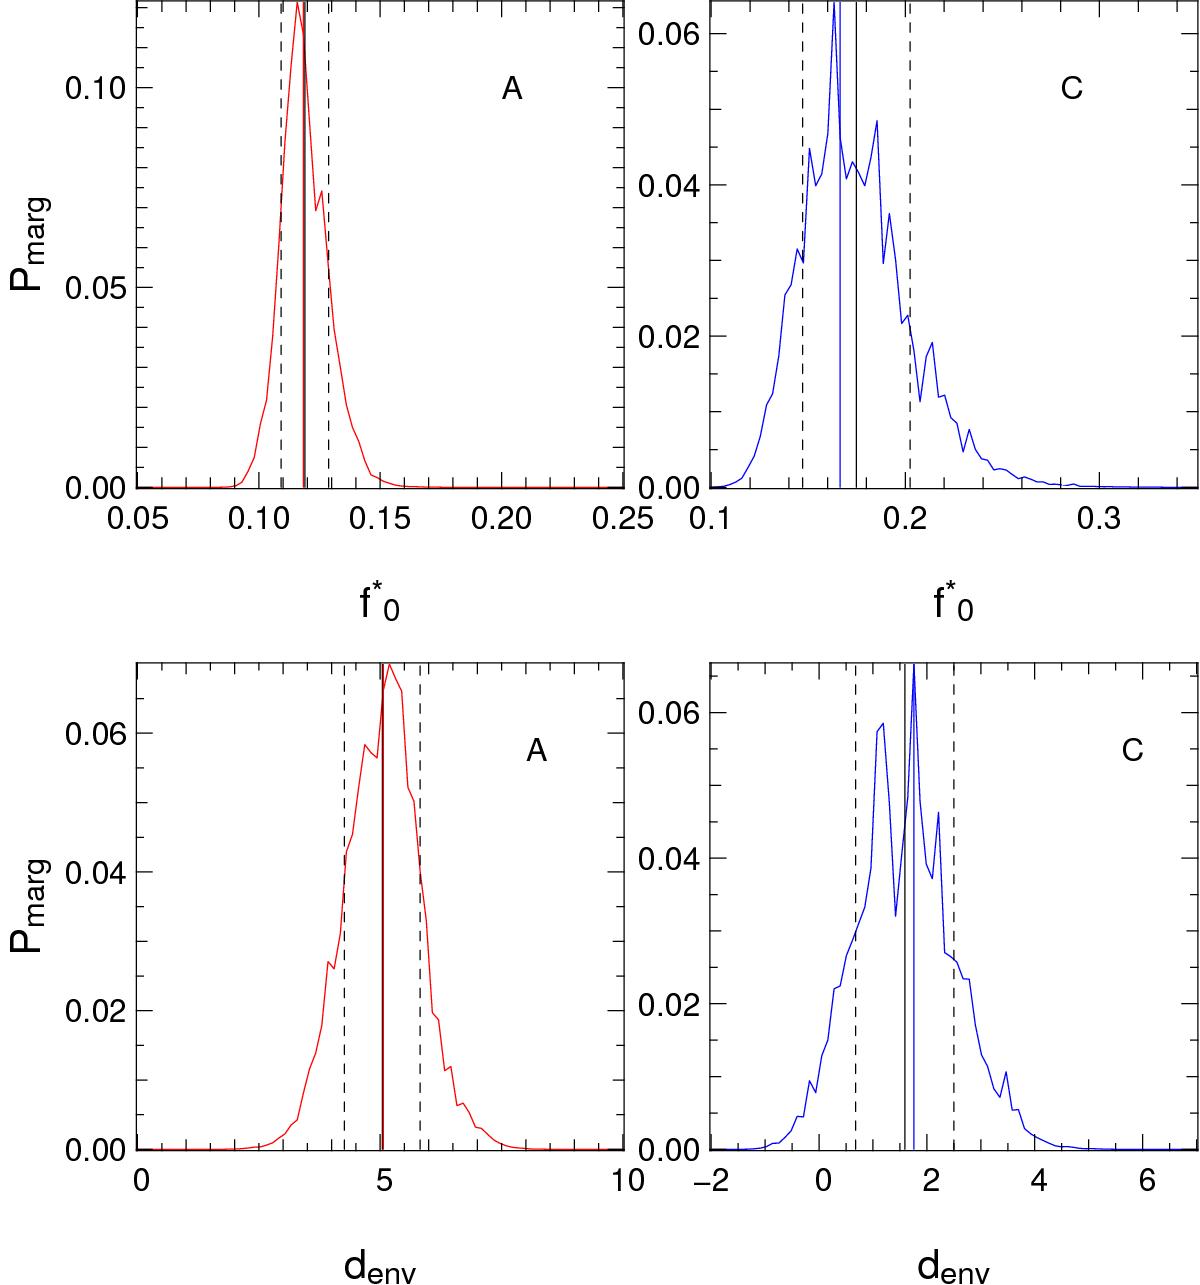
Marginalised probabilities of the chromatic parameters ![]() (top) and denv (bottom) for epoch A (left) and C (right). The average value is indicated by solid vertical line and the standard deviation is indicated by dashed lines. The value chosen for the image reconstructions is represent by a vertical solid line, which is red for epoch A and blue for epoch C.
(top) and denv (bottom) for epoch A (left) and C (right). The average value is indicated by solid vertical line and the standard deviation is indicated by dashed lines. The value chosen for the image reconstructions is represent by a vertical solid line, which is red for epoch A and blue for epoch C.
Current usage metrics show cumulative count of Article Views (full-text article views including HTML views, PDF and ePub downloads, according to the available data) and Abstracts Views on Vision4Press platform.
Data correspond to usage on the plateform after 2015. The current usage metrics is available 48-96 hours after online publication and is updated daily on week days.
Initial download of the metrics may take a while.