Fig. 5
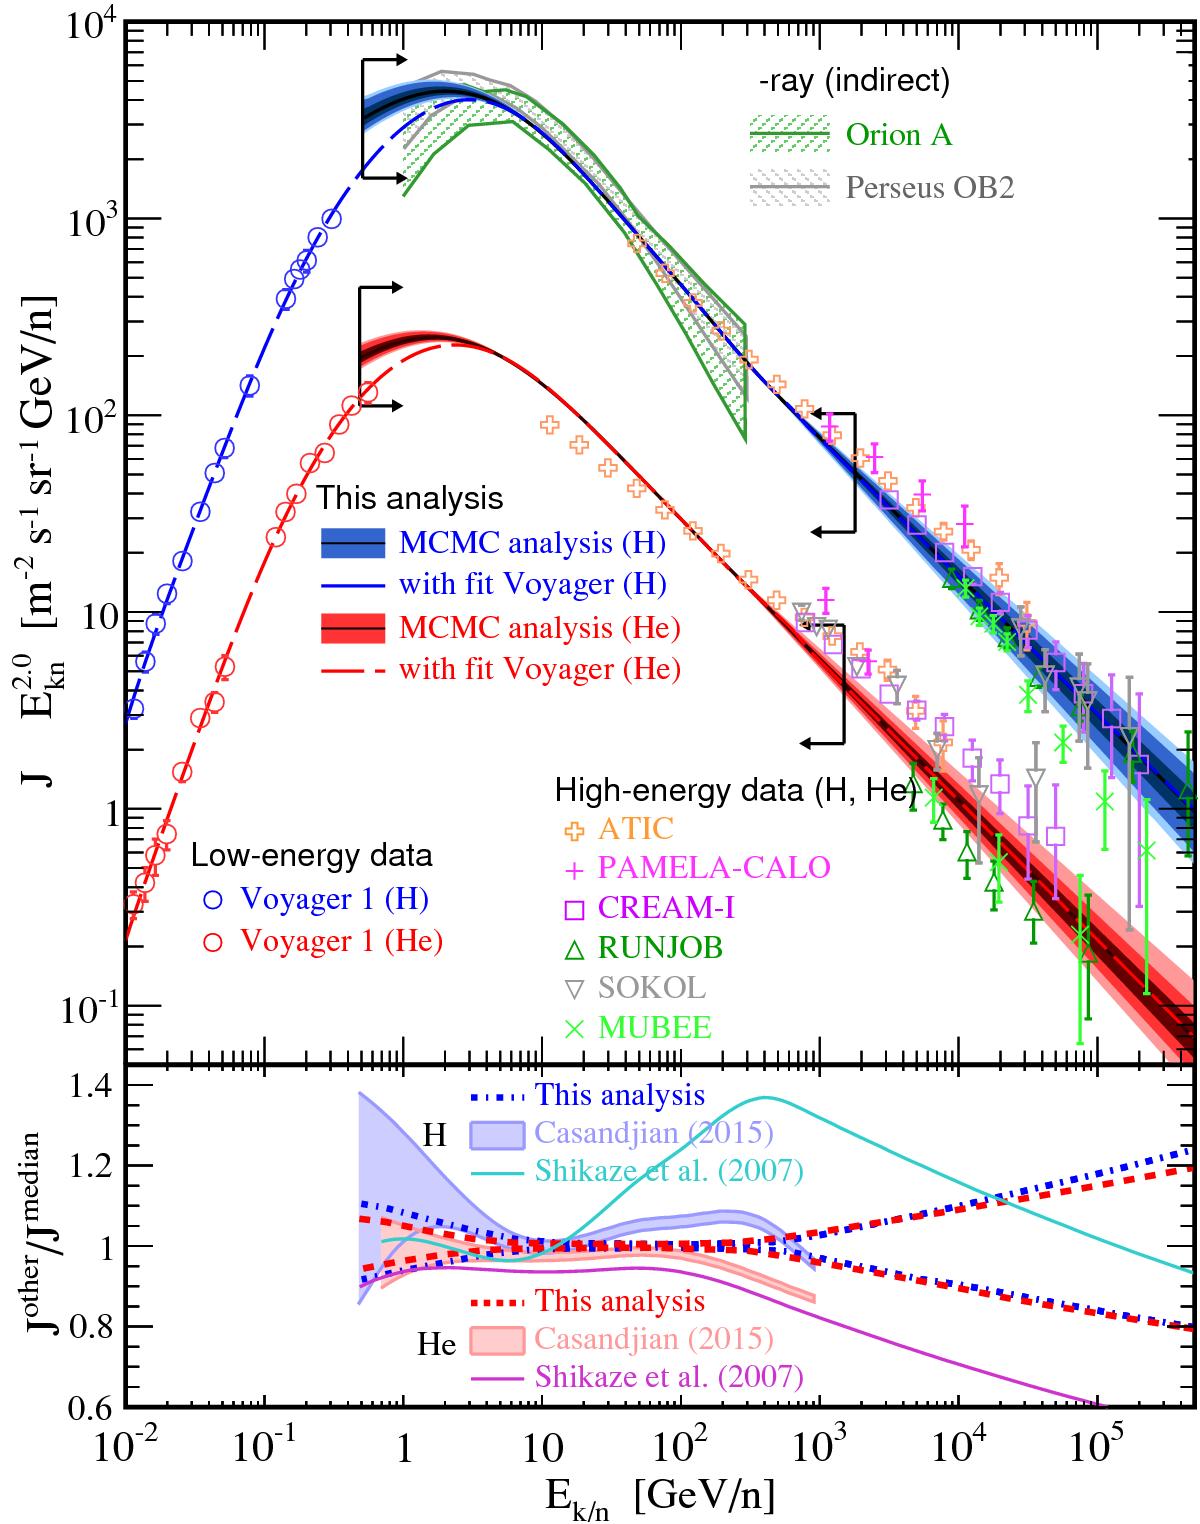
Same as Fig. 4, but compared to other direct or indirect IS flux determinations. Top panel a): green (Orion A) and grey (Perseus OB2) dashed areas are γ-ray derived limits from local giant molecular clouds using Fermi-LAT data (Yang et al. 2014); symbols are for low-energy Voyager 1 measurements (Stone et al. 2013) and high-energy data. Bottom panel b): thick lines are from the 68% CI of this analysis; shaded areas correspond to the 68%CI from a likelihood analysis of Fermi-LAT γ-ray emissivity, and PAMELA (2006−2008) plus AMS-01 (1998) p+He+e++e− analysis (Casandjian 2015); chained lines are from a χ2-minimisation analysis of BESS data (Shikaze et al. 2007).
Current usage metrics show cumulative count of Article Views (full-text article views including HTML views, PDF and ePub downloads, according to the available data) and Abstracts Views on Vision4Press platform.
Data correspond to usage on the plateform after 2015. The current usage metrics is available 48-96 hours after online publication and is updated daily on week days.
Initial download of the metrics may take a while.