Fig. 3
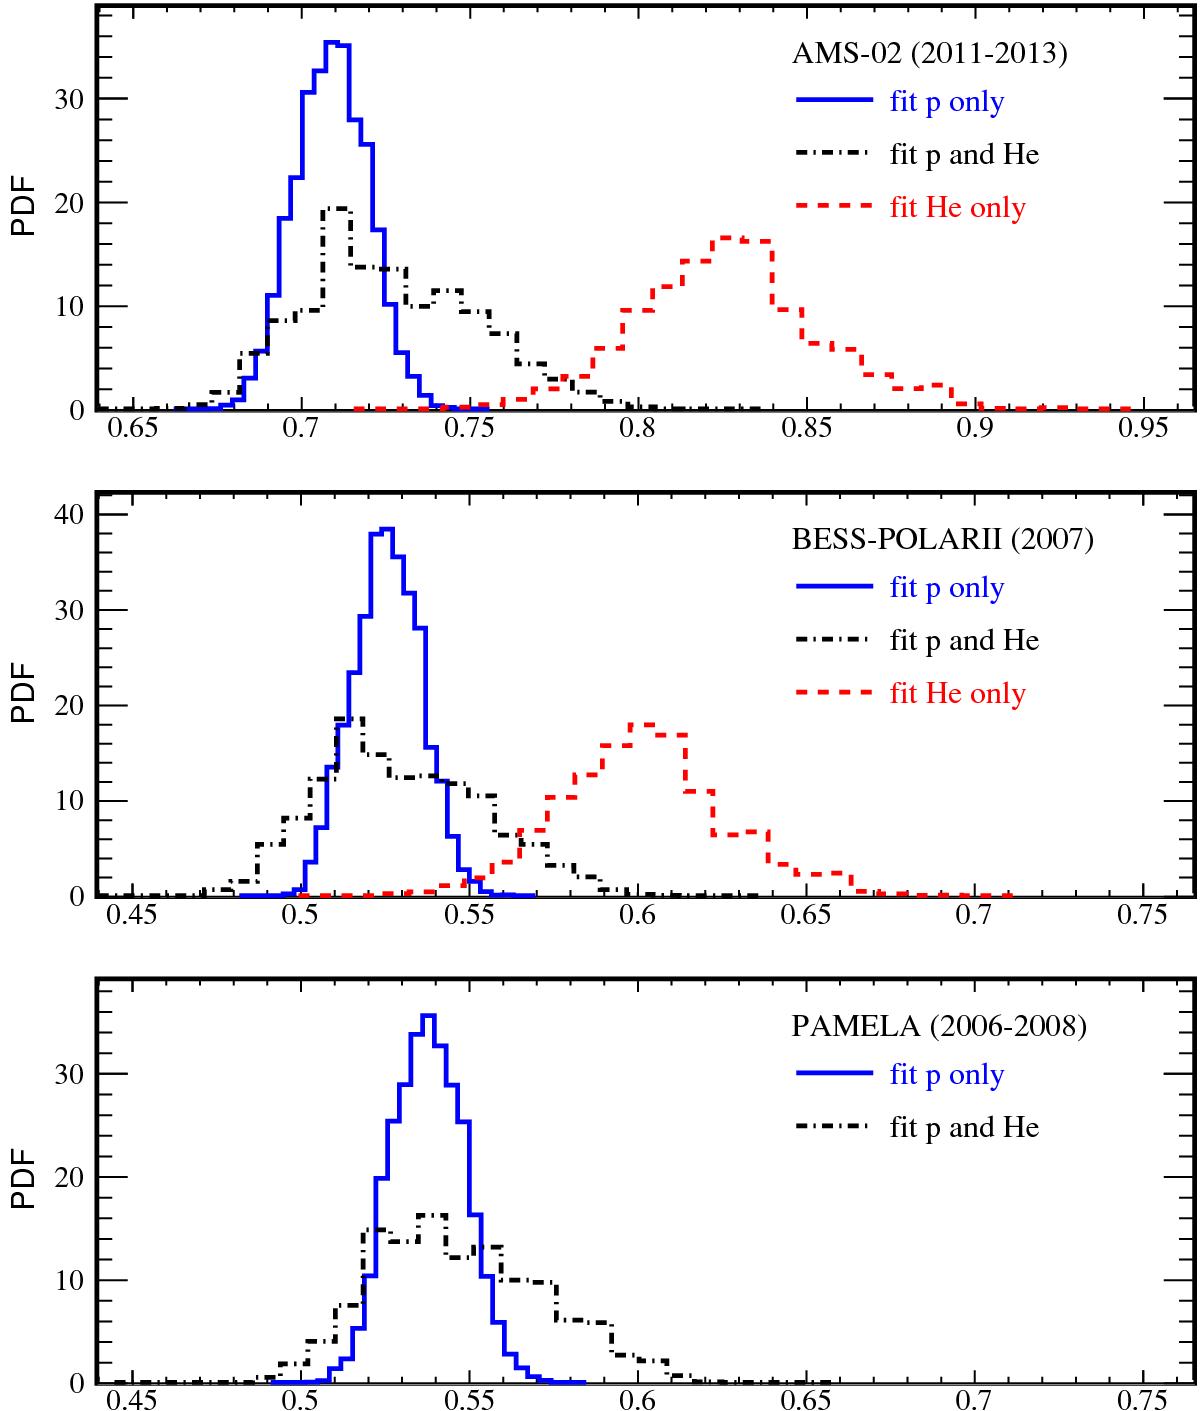
PDF of the solar modulation level φ for the three most recent datasets with the highest statistics. We show the results for a fit on all selected data from Table 1, for p data alone (blue solid line), He data alone (red dashed line), and p and He data simultaneously (black dash-dotted line).
Current usage metrics show cumulative count of Article Views (full-text article views including HTML views, PDF and ePub downloads, according to the available data) and Abstracts Views on Vision4Press platform.
Data correspond to usage on the plateform after 2015. The current usage metrics is available 48-96 hours after online publication and is updated daily on week days.
Initial download of the metrics may take a while.