Fig. 2
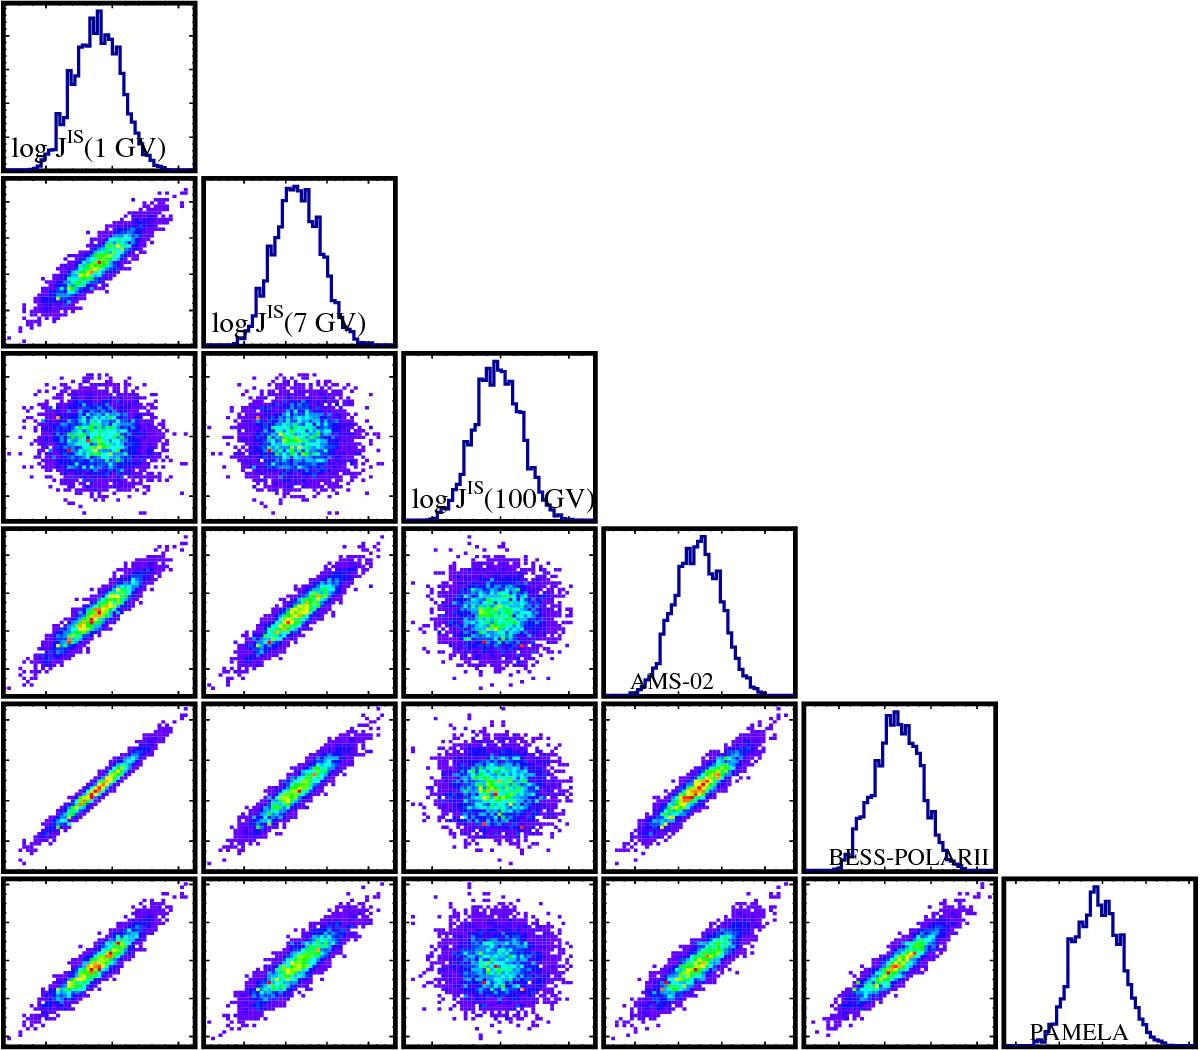
PDF (diagonal) and 2D correlations (off-diagonal) plots for three selected knots y = log JIS(R) at position { R0,R1,R3 } = { 1 ,7 ,100 } GV and φ for three high-statistics datasets AMS-02, BESS-POLARII, and PAMELA (2006−2008): positive correlations are observed for all low-energy knots and datasets; knots above 100 GV show no correlation with any other parameter (the parameter distribution only depends then on the data uncertainties).
Current usage metrics show cumulative count of Article Views (full-text article views including HTML views, PDF and ePub downloads, according to the available data) and Abstracts Views on Vision4Press platform.
Data correspond to usage on the plateform after 2015. The current usage metrics is available 48-96 hours after online publication and is updated daily on week days.
Initial download of the metrics may take a while.