Fig. 1
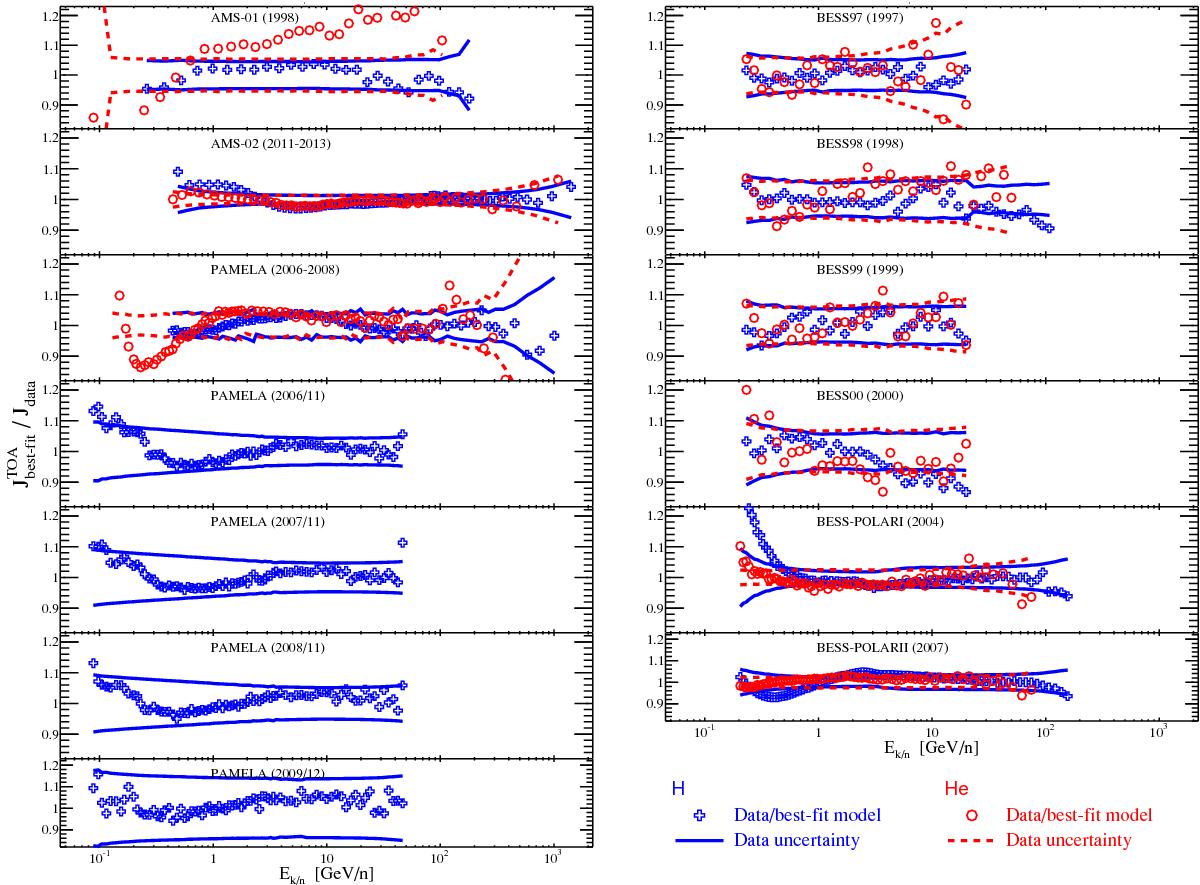
Ratio of the best-fit model for p (filled black circles) and He (empty red circles) to data for the experiments passing our selection (see Table 1). The solid blue (dashed red) lines correspond to the uncertainties (statistical and systematics combined) on the p (He) measurements. We note that the AMS-01 (top left panel) and PAMELA (2006−2008) He data (red empty circles; left panel, third row) are excluded based on their χ2 value (see Table 1) and are shown for illustration only.
Current usage metrics show cumulative count of Article Views (full-text article views including HTML views, PDF and ePub downloads, according to the available data) and Abstracts Views on Vision4Press platform.
Data correspond to usage on the plateform after 2015. The current usage metrics is available 48-96 hours after online publication and is updated daily on week days.
Initial download of the metrics may take a while.