Fig. B.1
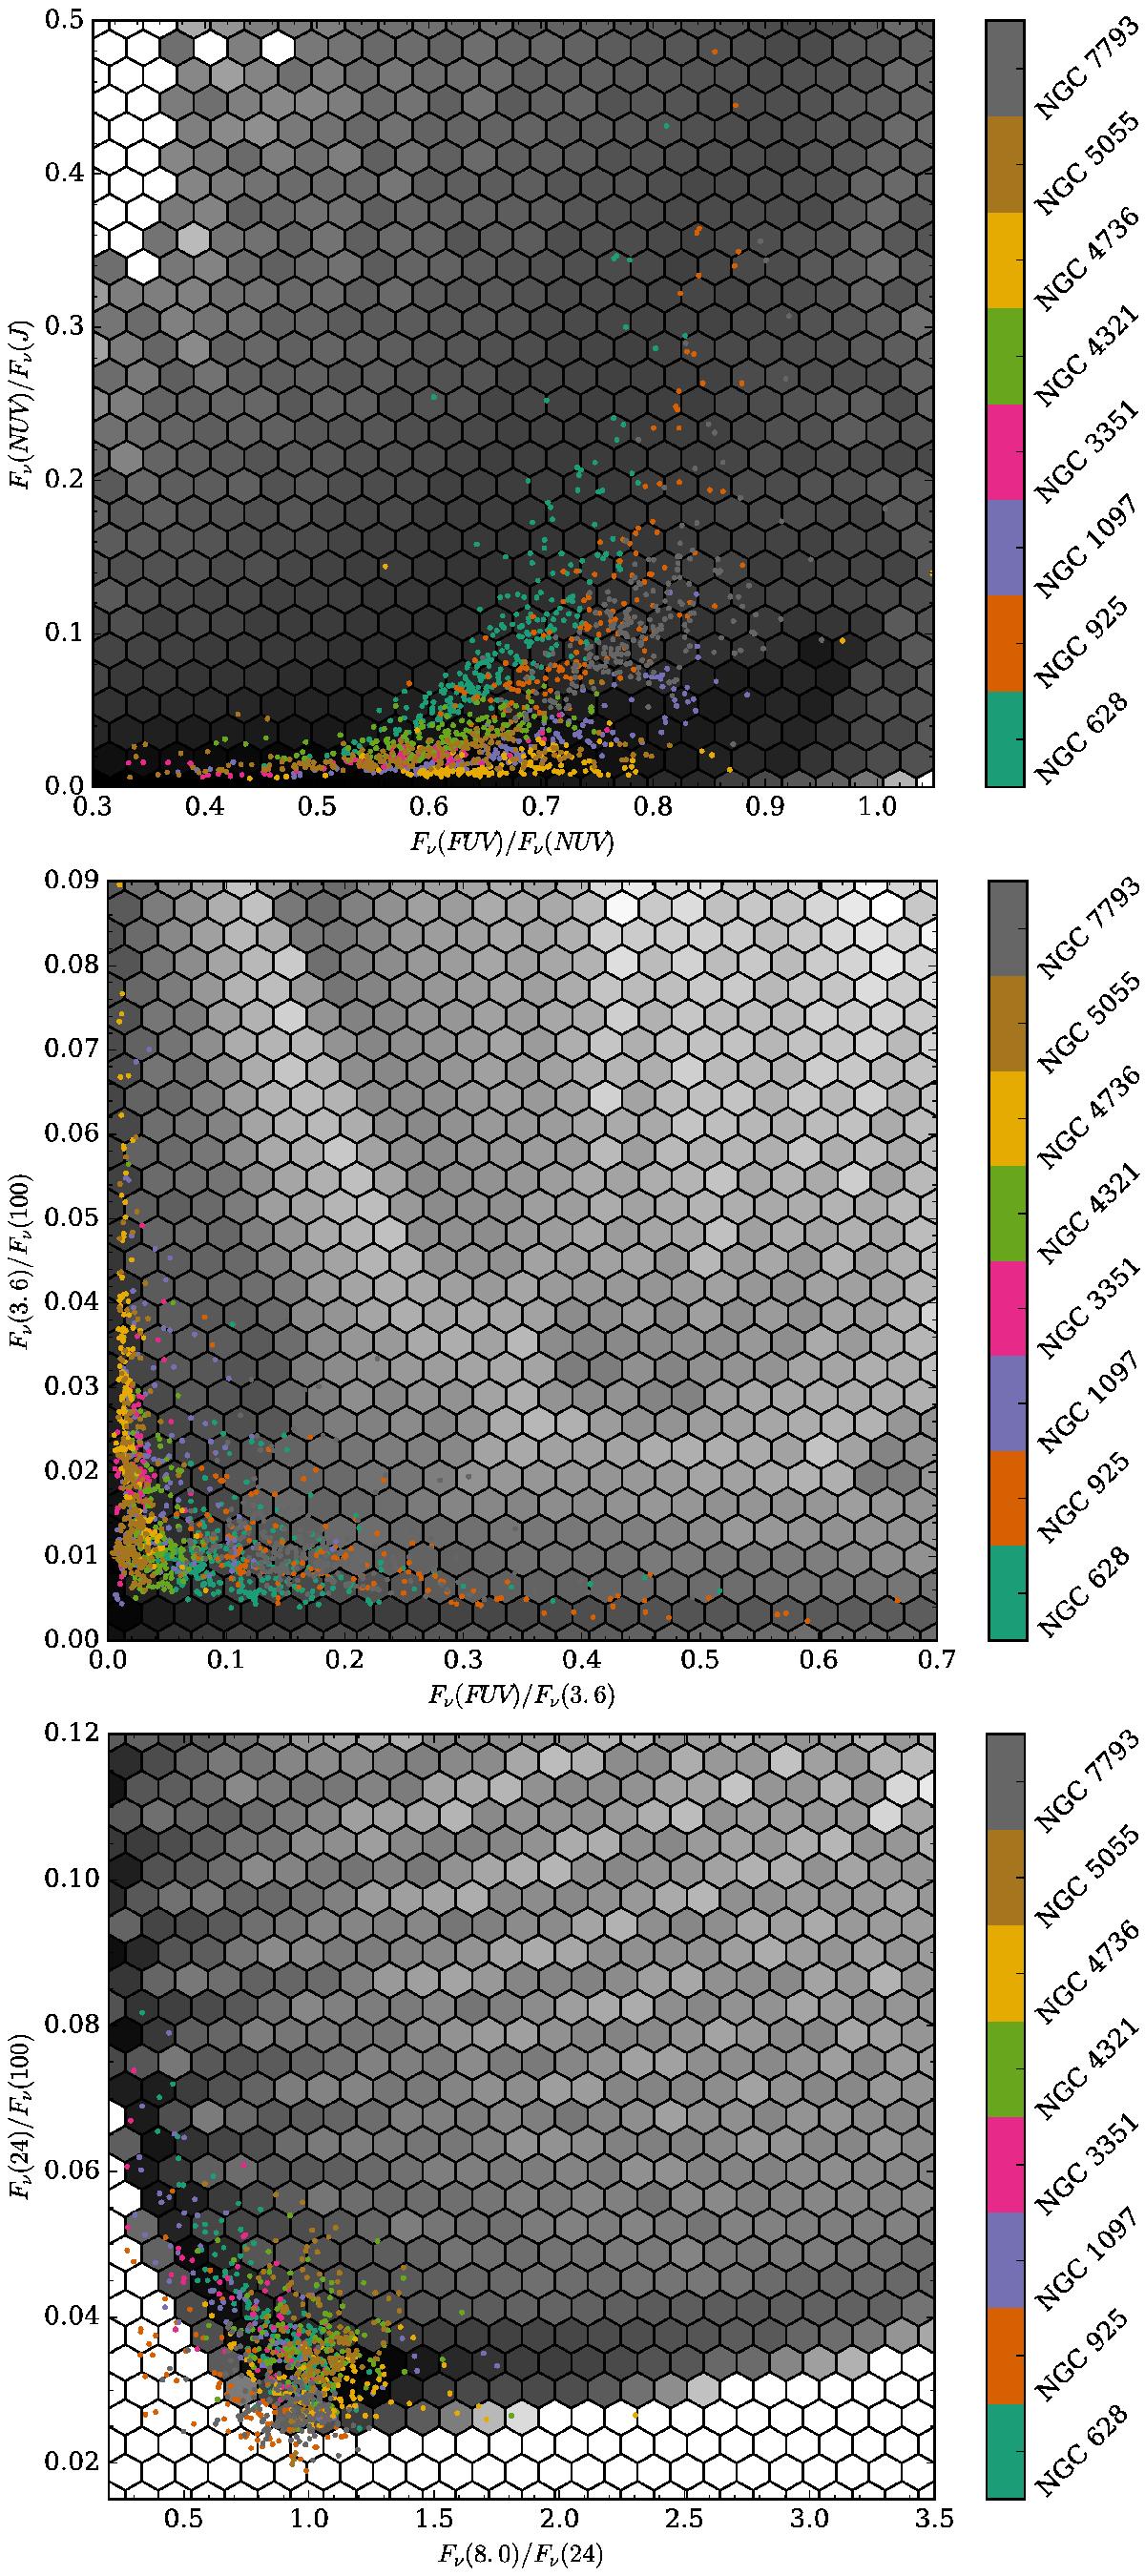
Comparison of some of the observed colours for all the regions in the sample (coloured points) with the colour space covered by the models (grey hexagons). The selected colours are representative of young and old stellar populations and of the dust. The colour of each dot indicates the galaxy following the colour bar on the right. The density of models is indicated by the shade of the hexagonal bins, following a logarithmic scale. Black indicates the highest density of models, whereas white indicates the absence of models in the particular bin.
Current usage metrics show cumulative count of Article Views (full-text article views including HTML views, PDF and ePub downloads, according to the available data) and Abstracts Views on Vision4Press platform.
Data correspond to usage on the plateform after 2015. The current usage metrics is available 48-96 hours after online publication and is updated daily on week days.
Initial download of the metrics may take a while.