Fig. 8
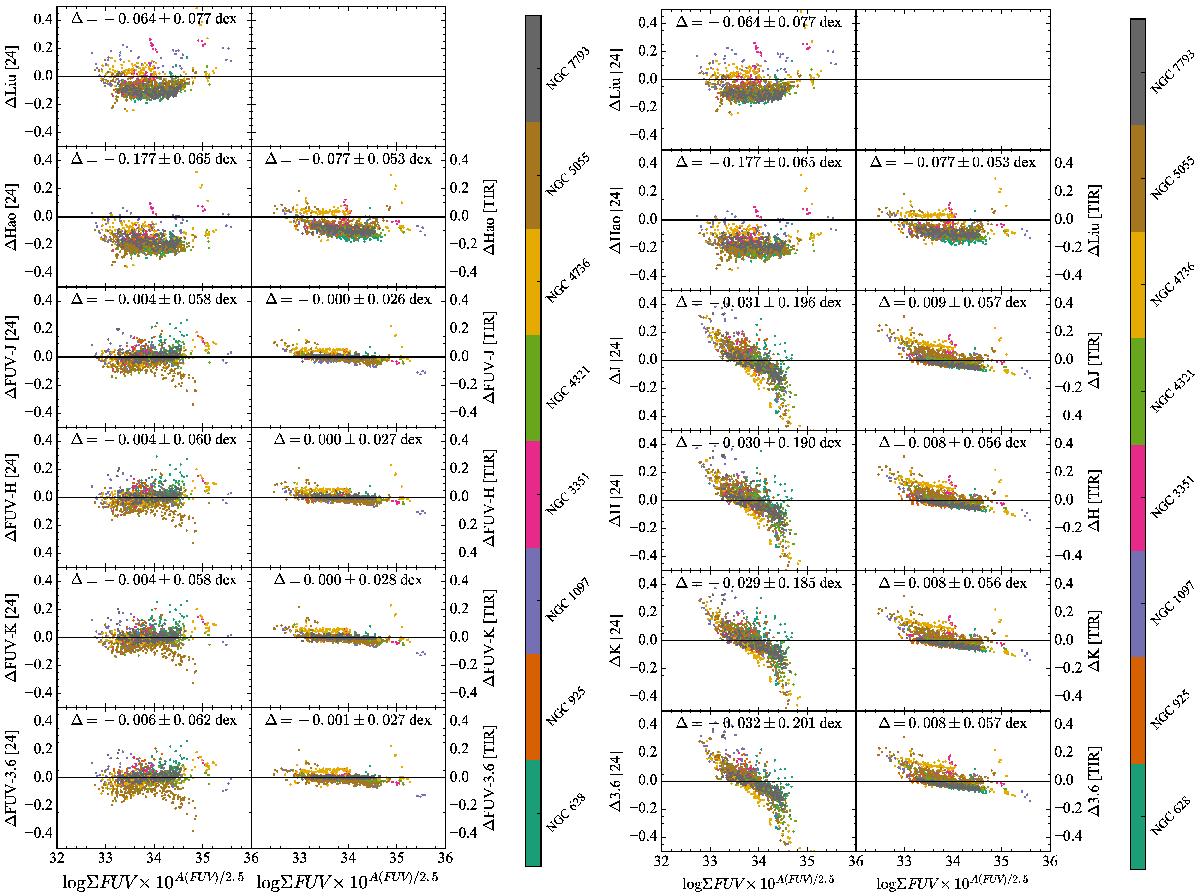
Left: difference between the CIGALE attenuation-corrected FUV luminosities per unit area and those estimated using a constant ki from Liu et al. (2011) and Hao et al. (2011) (y-axis, first two rows), a variable ki estimated from one of the linear relations with the FUV−NIR colours given in Table 4 (y-axis, other rows), and the estimated FUV attenuation directly obtained from the CIGALE SED modelling (x-axis). The first column is based on the 24 μm band and the second column on the TIR. Right: same but estimating ki from one of the linear relations with the NIR luminosity density per unit area given in Table 5.
Current usage metrics show cumulative count of Article Views (full-text article views including HTML views, PDF and ePub downloads, according to the available data) and Abstracts Views on Vision4Press platform.
Data correspond to usage on the plateform after 2015. The current usage metrics is available 48-96 hours after online publication and is updated daily on week days.
Initial download of the metrics may take a while.