Fig. 6
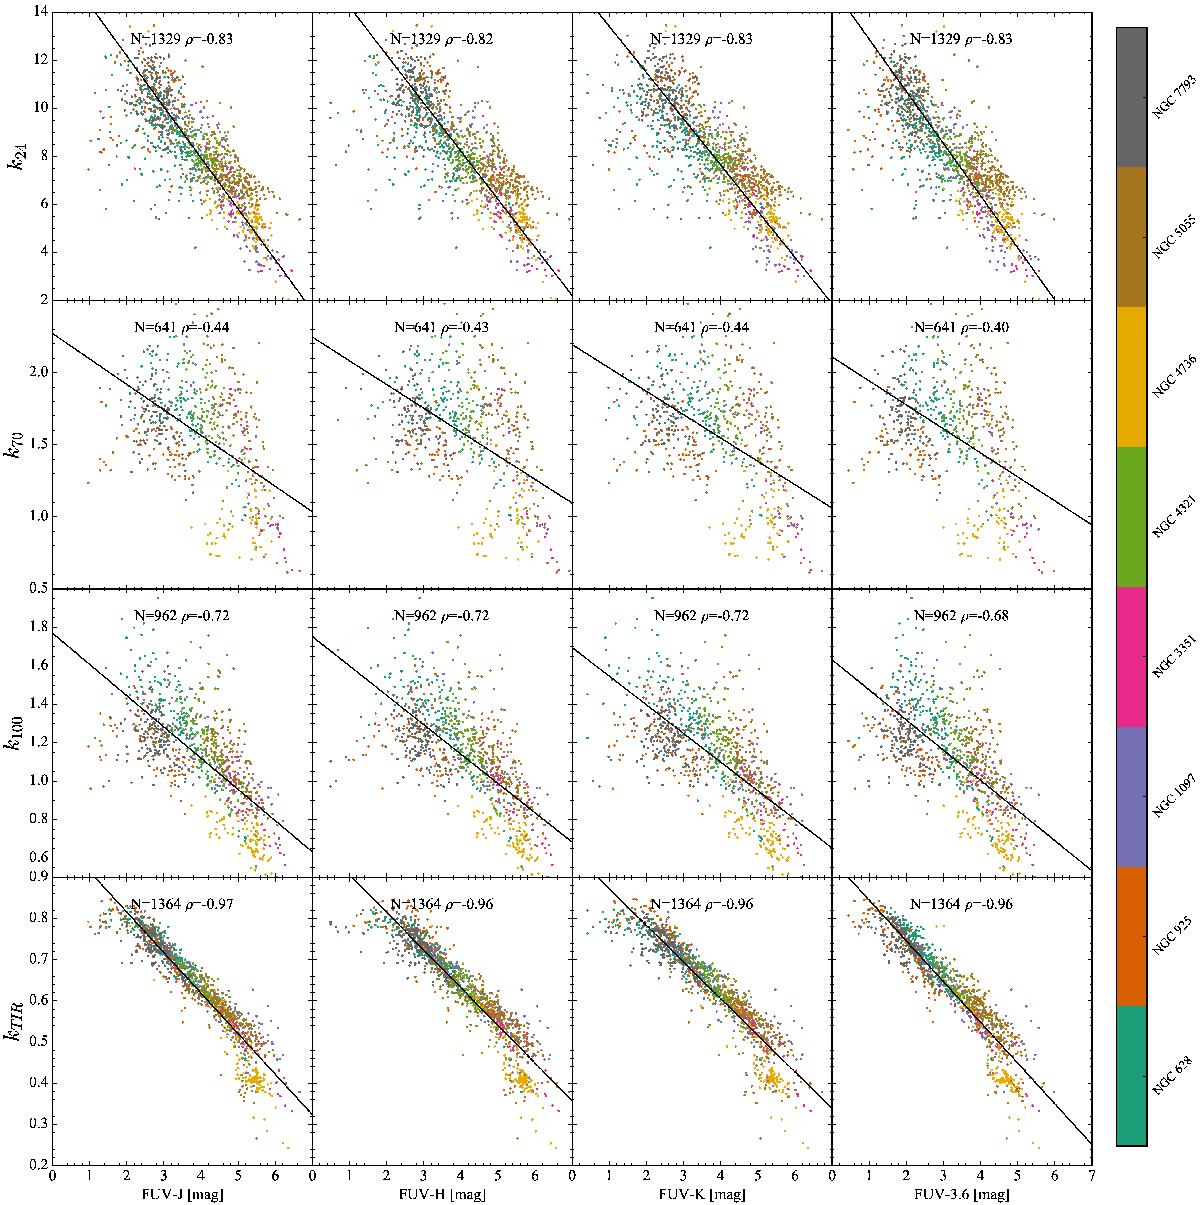
ki versus the FUV−J, FUV−H, FUV−Ks, and FUV−3.6 colours (AB magnitudes) for each galaxy in the sample at 24 μm, 70 μm, 100 μm, and for the TIR. The colour of each dot indicates the galaxy following the colour bar to the right. We have only selected regions detected at least at a 5σ level in the relevant band. This affects mostly the 70 μm and 100 μm bands. The number of regions and Spearman’s rank correlation coefficient are shown at the top of each plot. The black lines represent the best linear fits using an orthogonal distance regression algorithm (see the caption of Table 4 for a more detailed description). The best-fit parameters along with the corresponding uncertainties are provided in Table 4.
Current usage metrics show cumulative count of Article Views (full-text article views including HTML views, PDF and ePub downloads, according to the available data) and Abstracts Views on Vision4Press platform.
Data correspond to usage on the plateform after 2015. The current usage metrics is available 48-96 hours after online publication and is updated daily on week days.
Initial download of the metrics may take a while.