Fig. 5
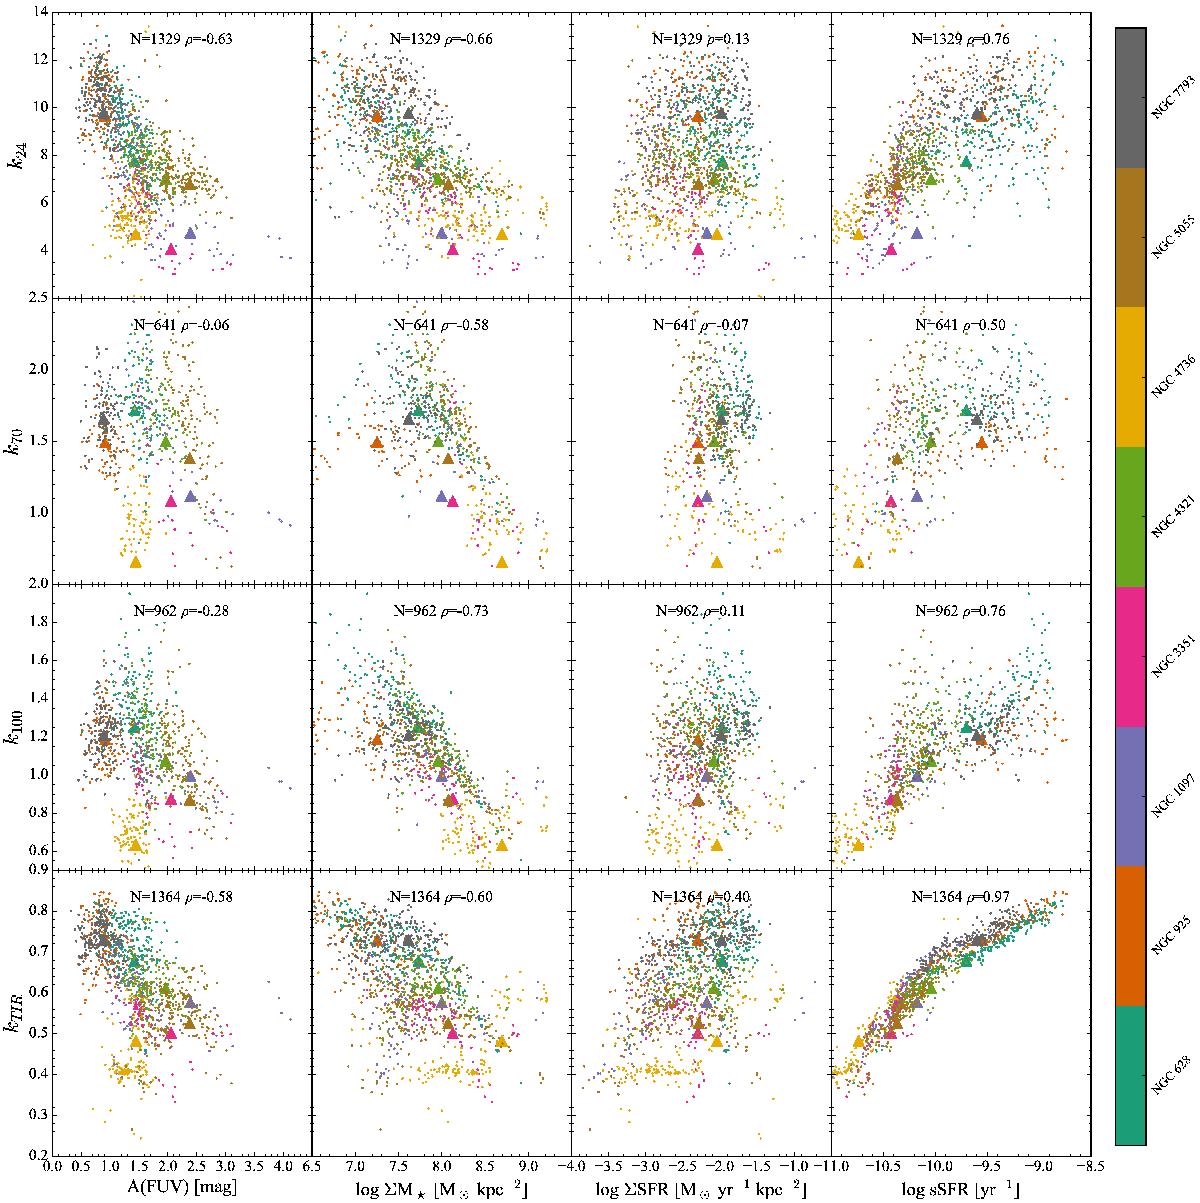
ki versus the FUV attenuation (left), stellar mass surface density (centre left), the SFR surface density averaged over 100 Myr (centre right), and sSFR averaged over 100 Myr (right) for all the galaxies in the sample. Each dot represents one pixel and the colour indicates the galaxy following the colour bar on the right. We only selected regions detected at least at a 5σ level in the relevant band. This affects mostly the 70 μm and 100 μm bands as they are the shallowest. The number of regions and the Spearman’s rank correlation coefficient are shown at the top of each plot. Finally, triangles represent the global value for each galaxy in the sample, taking into account all pixels detected at least at a 1σ level in all bands.
Current usage metrics show cumulative count of Article Views (full-text article views including HTML views, PDF and ePub downloads, according to the available data) and Abstracts Views on Vision4Press platform.
Data correspond to usage on the plateform after 2015. The current usage metrics is available 48-96 hours after online publication and is updated daily on week days.
Initial download of the metrics may take a while.