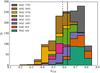
Fig. 3
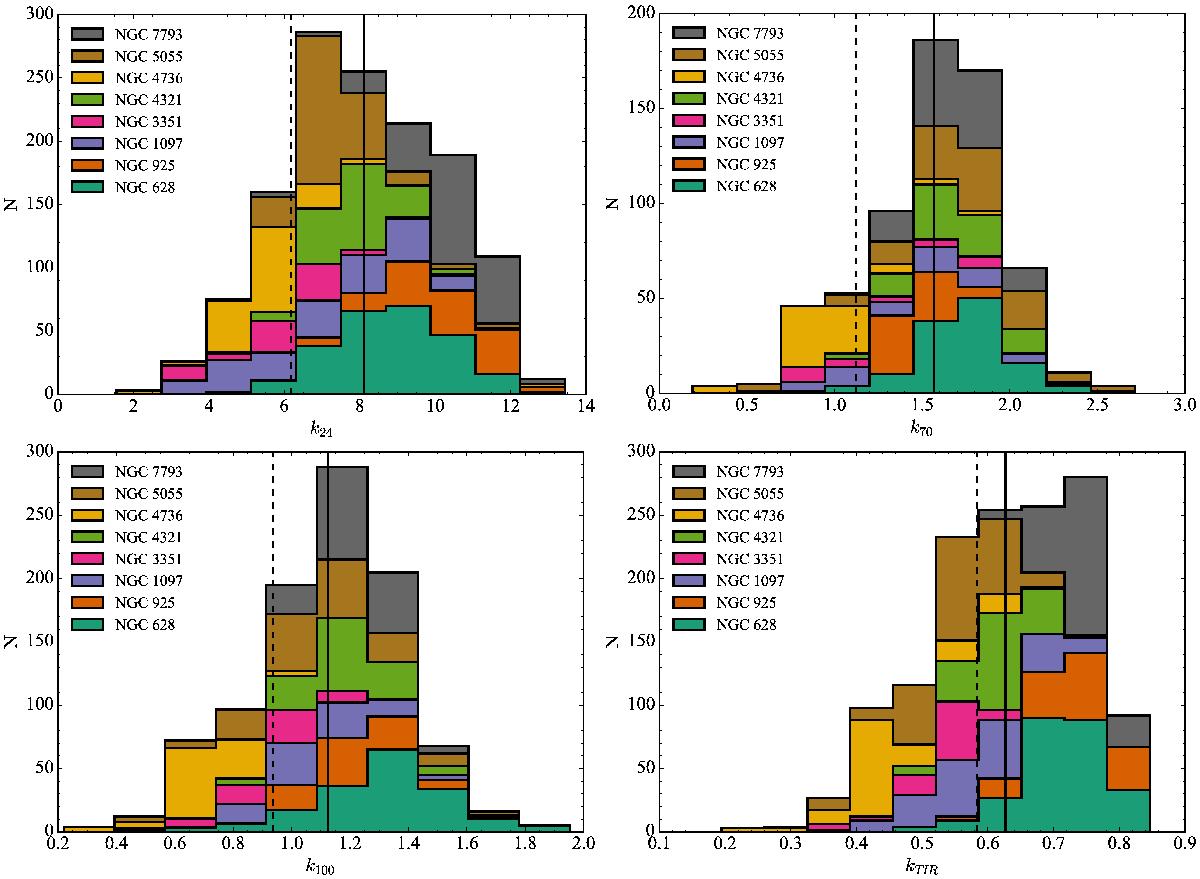
Stacked distributions of ki from 24 μm (top left) to 100 μm and the TIR (bottom right) for NGC 628, NGC 925, NGC 1097, NGC 3351 NGC 4321, NGC 4736, NGC 5055, and NGC 7793. The solid black line indicates the mean value for the sample whereas the dashed black line indicates the luminosity-weighted mean value. We selected only regions detected at least at a 5σ level in the relevant band. This affects mostly the 70 μm and 100 μm bands.
Current usage metrics show cumulative count of Article Views (full-text article views including HTML views, PDF and ePub downloads, according to the available data) and Abstracts Views on Vision4Press platform.
Data correspond to usage on the plateform after 2015. The current usage metrics is available 48-96 hours after online publication and is updated daily on week days.
Initial download of the metrics may take a while.